Heuristic Markup
I have a background in Civil Engineering, but I have always been fascinated about design. With the help of a mentor, I transitioned into this field and it has been an exciting learning journey...
📌 Major problem areas
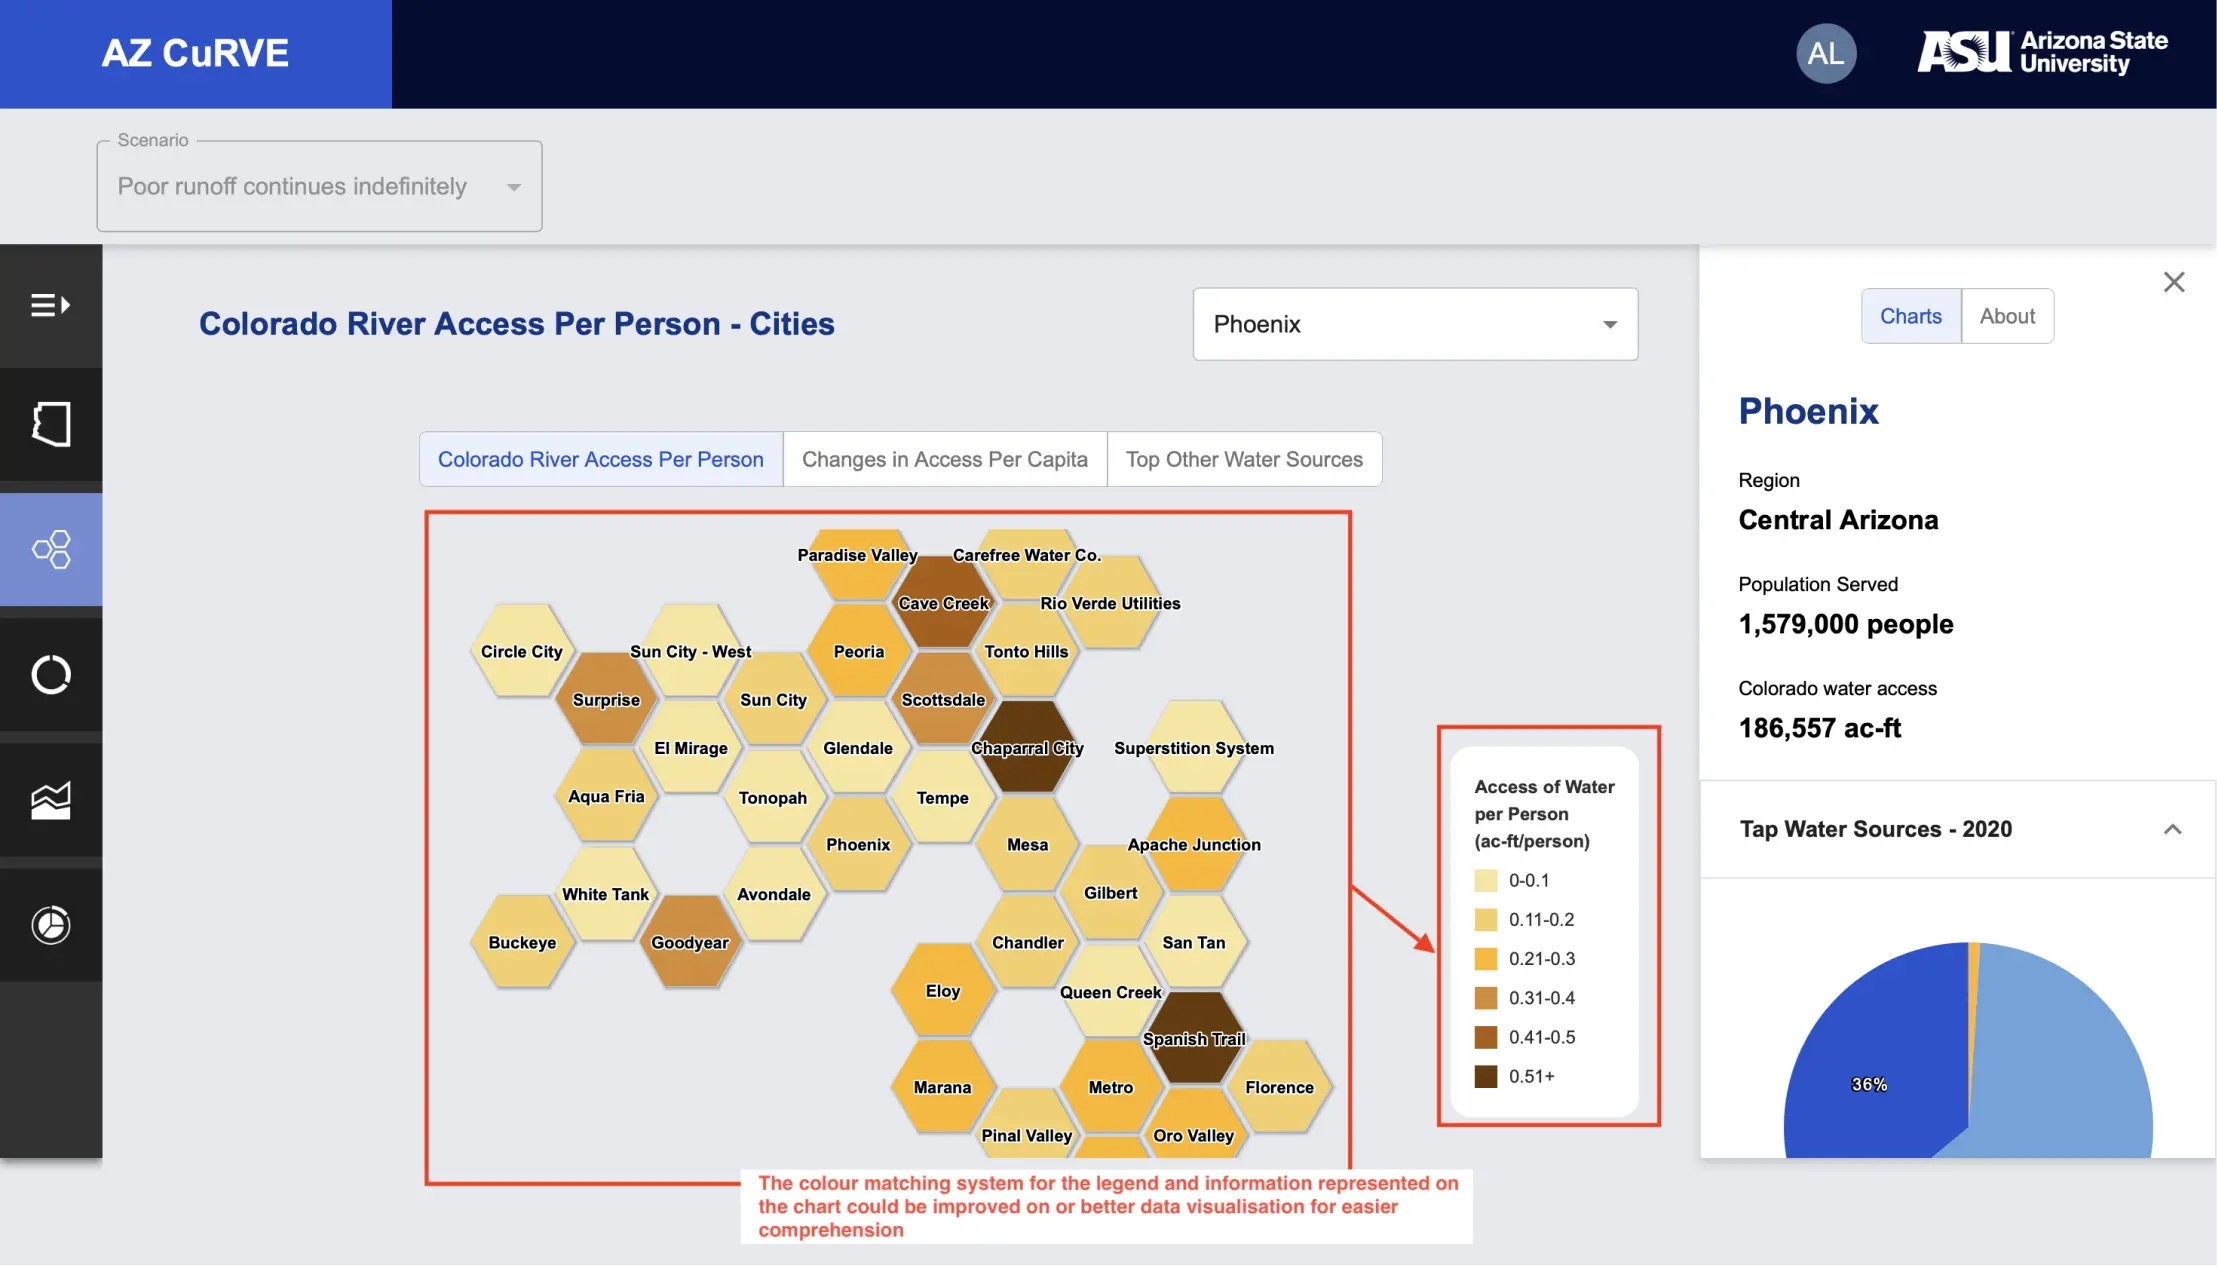
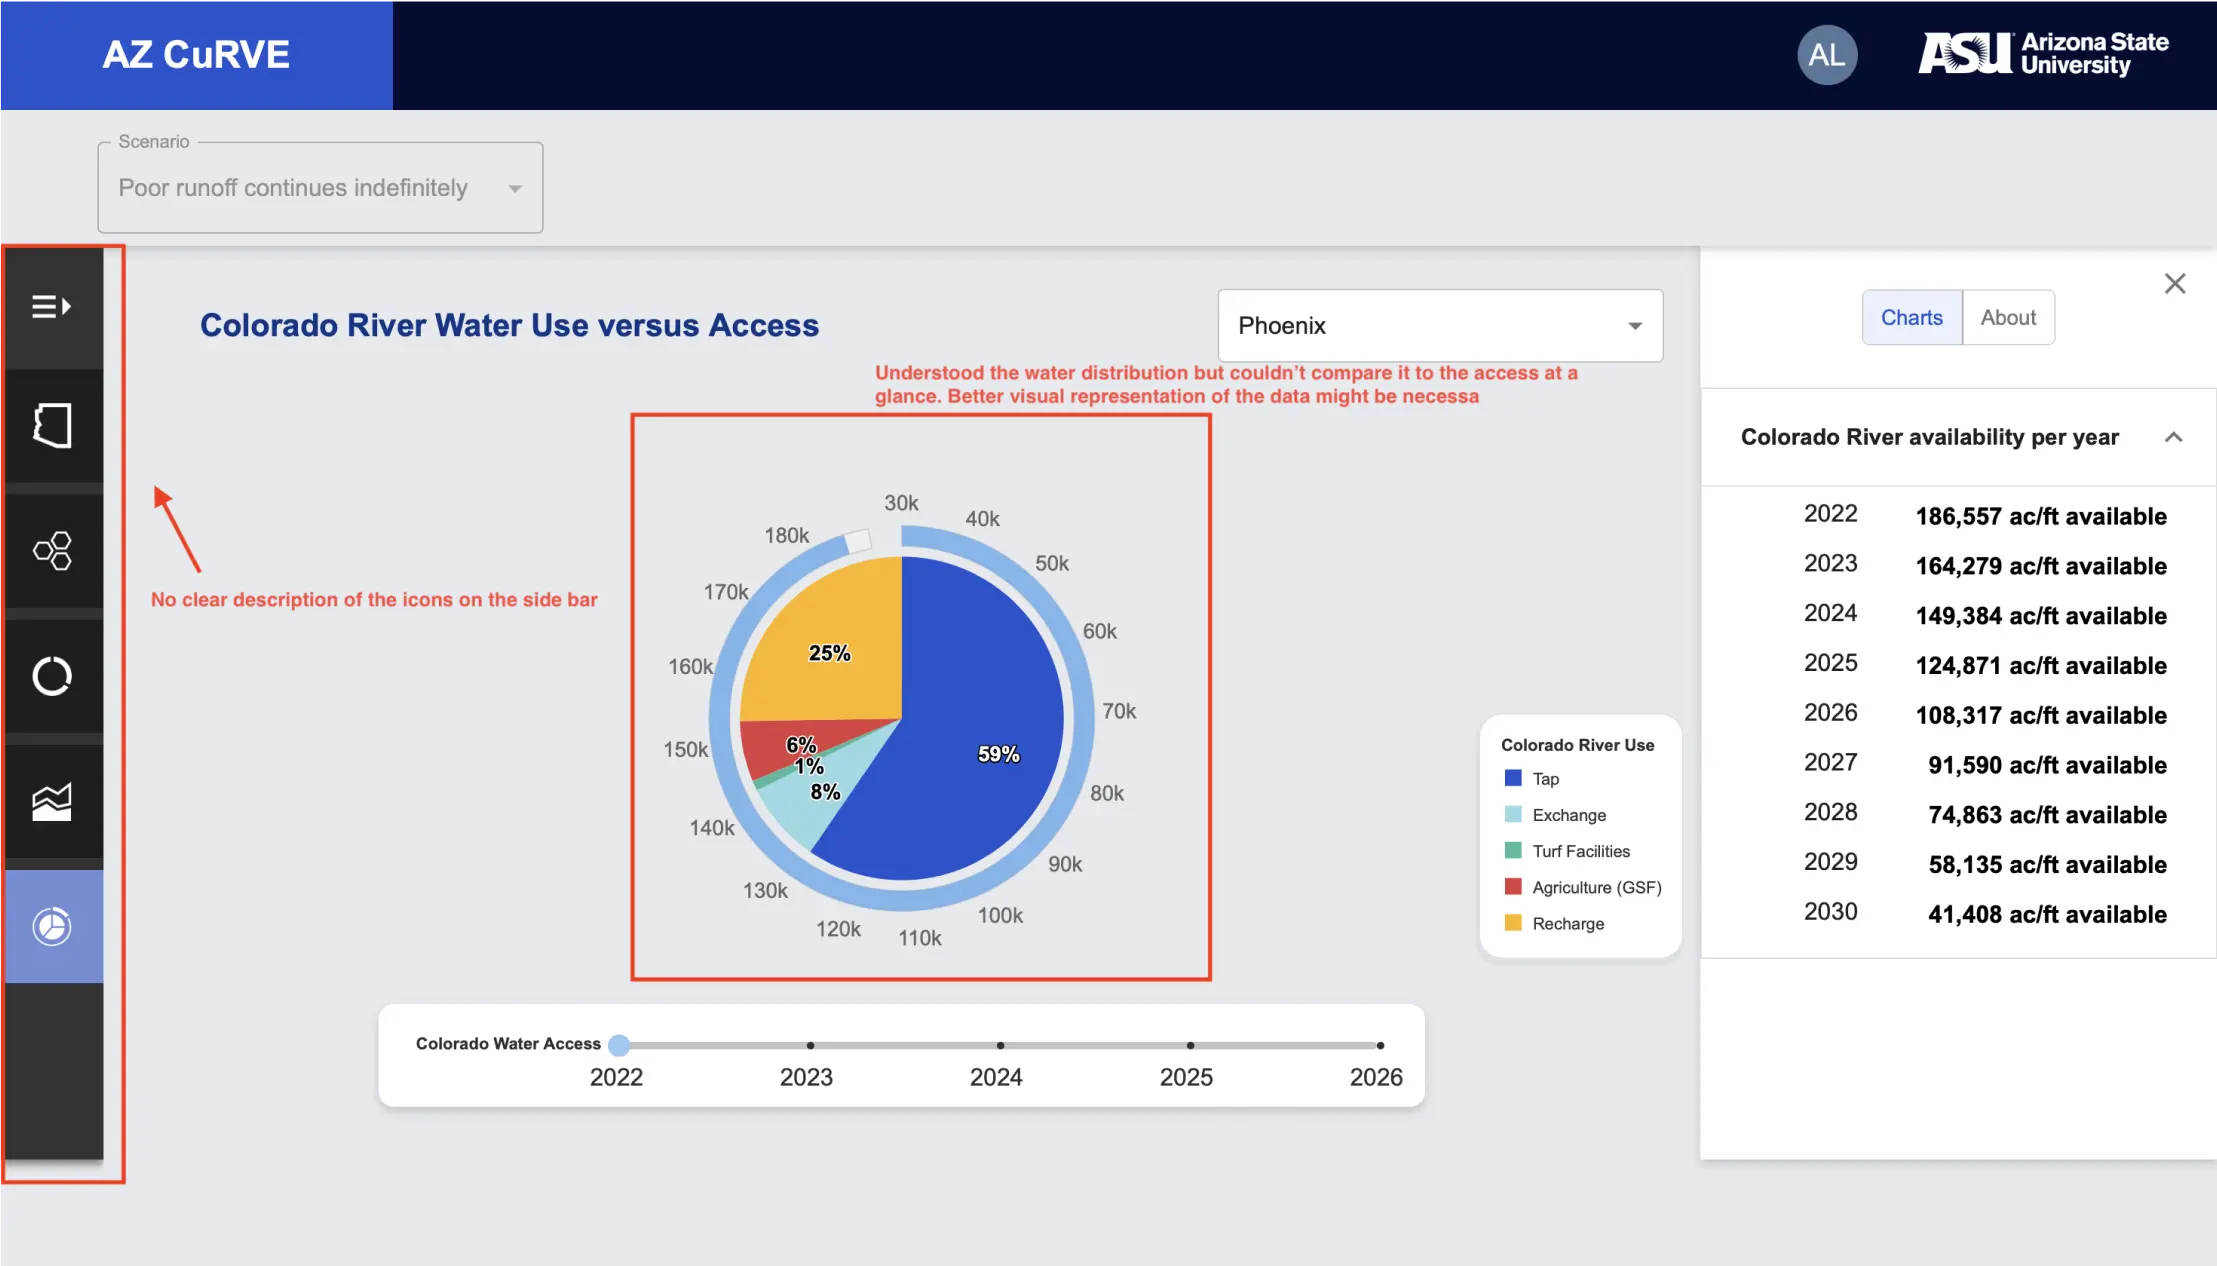
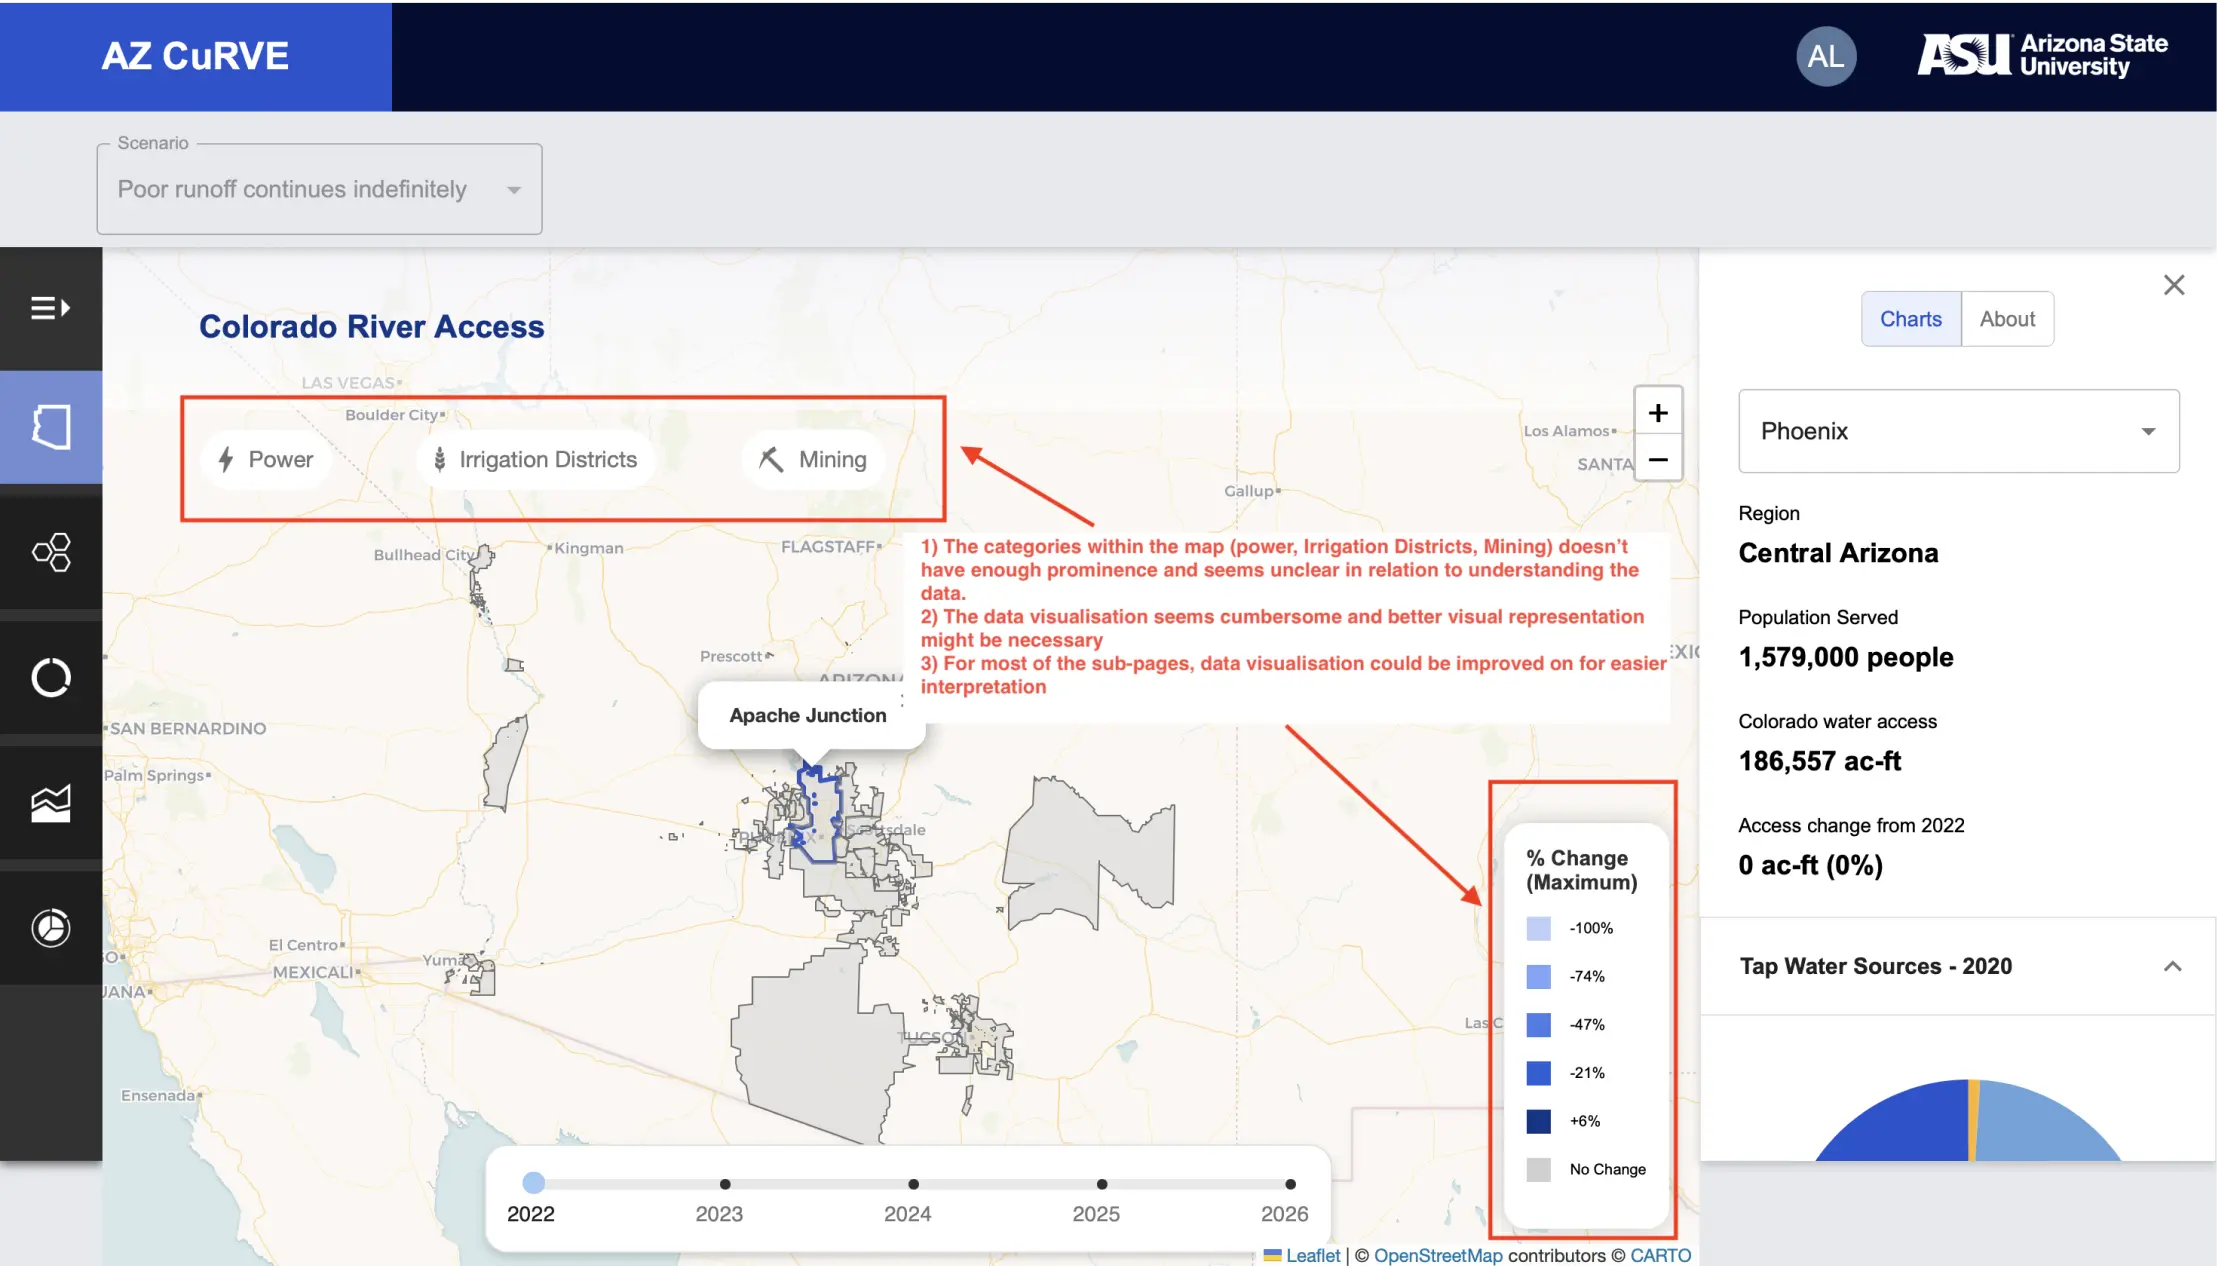
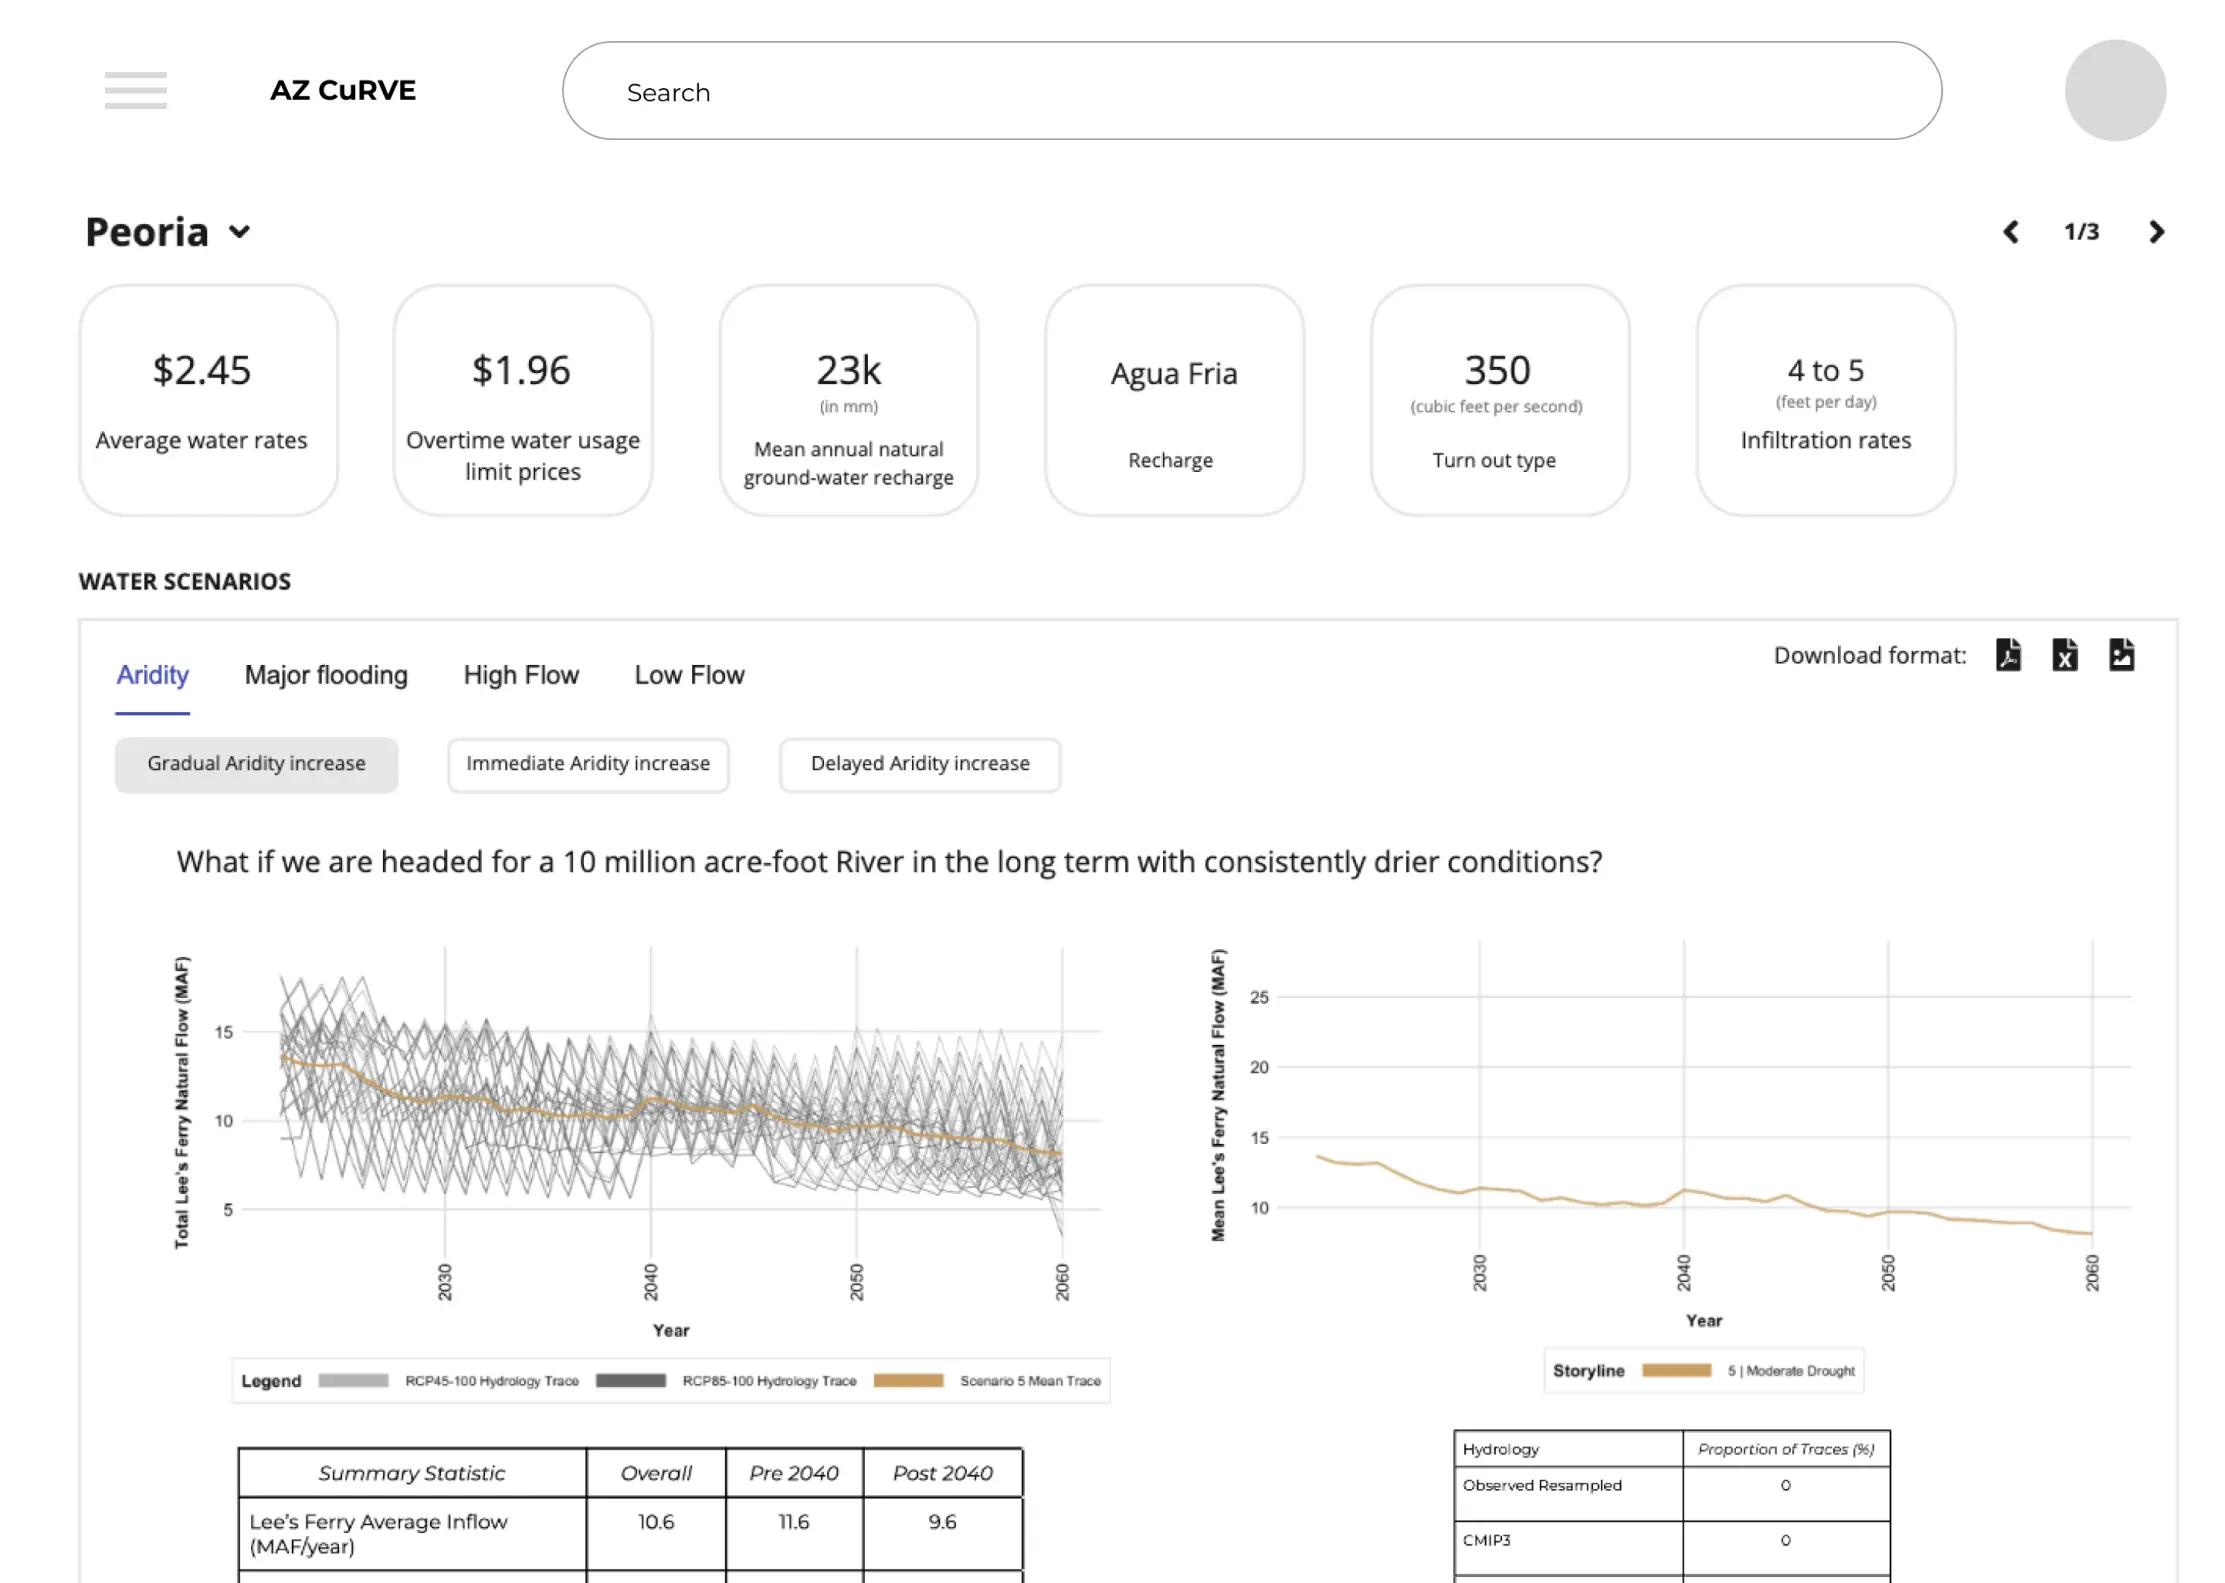
Unintuitive data representation and visualization
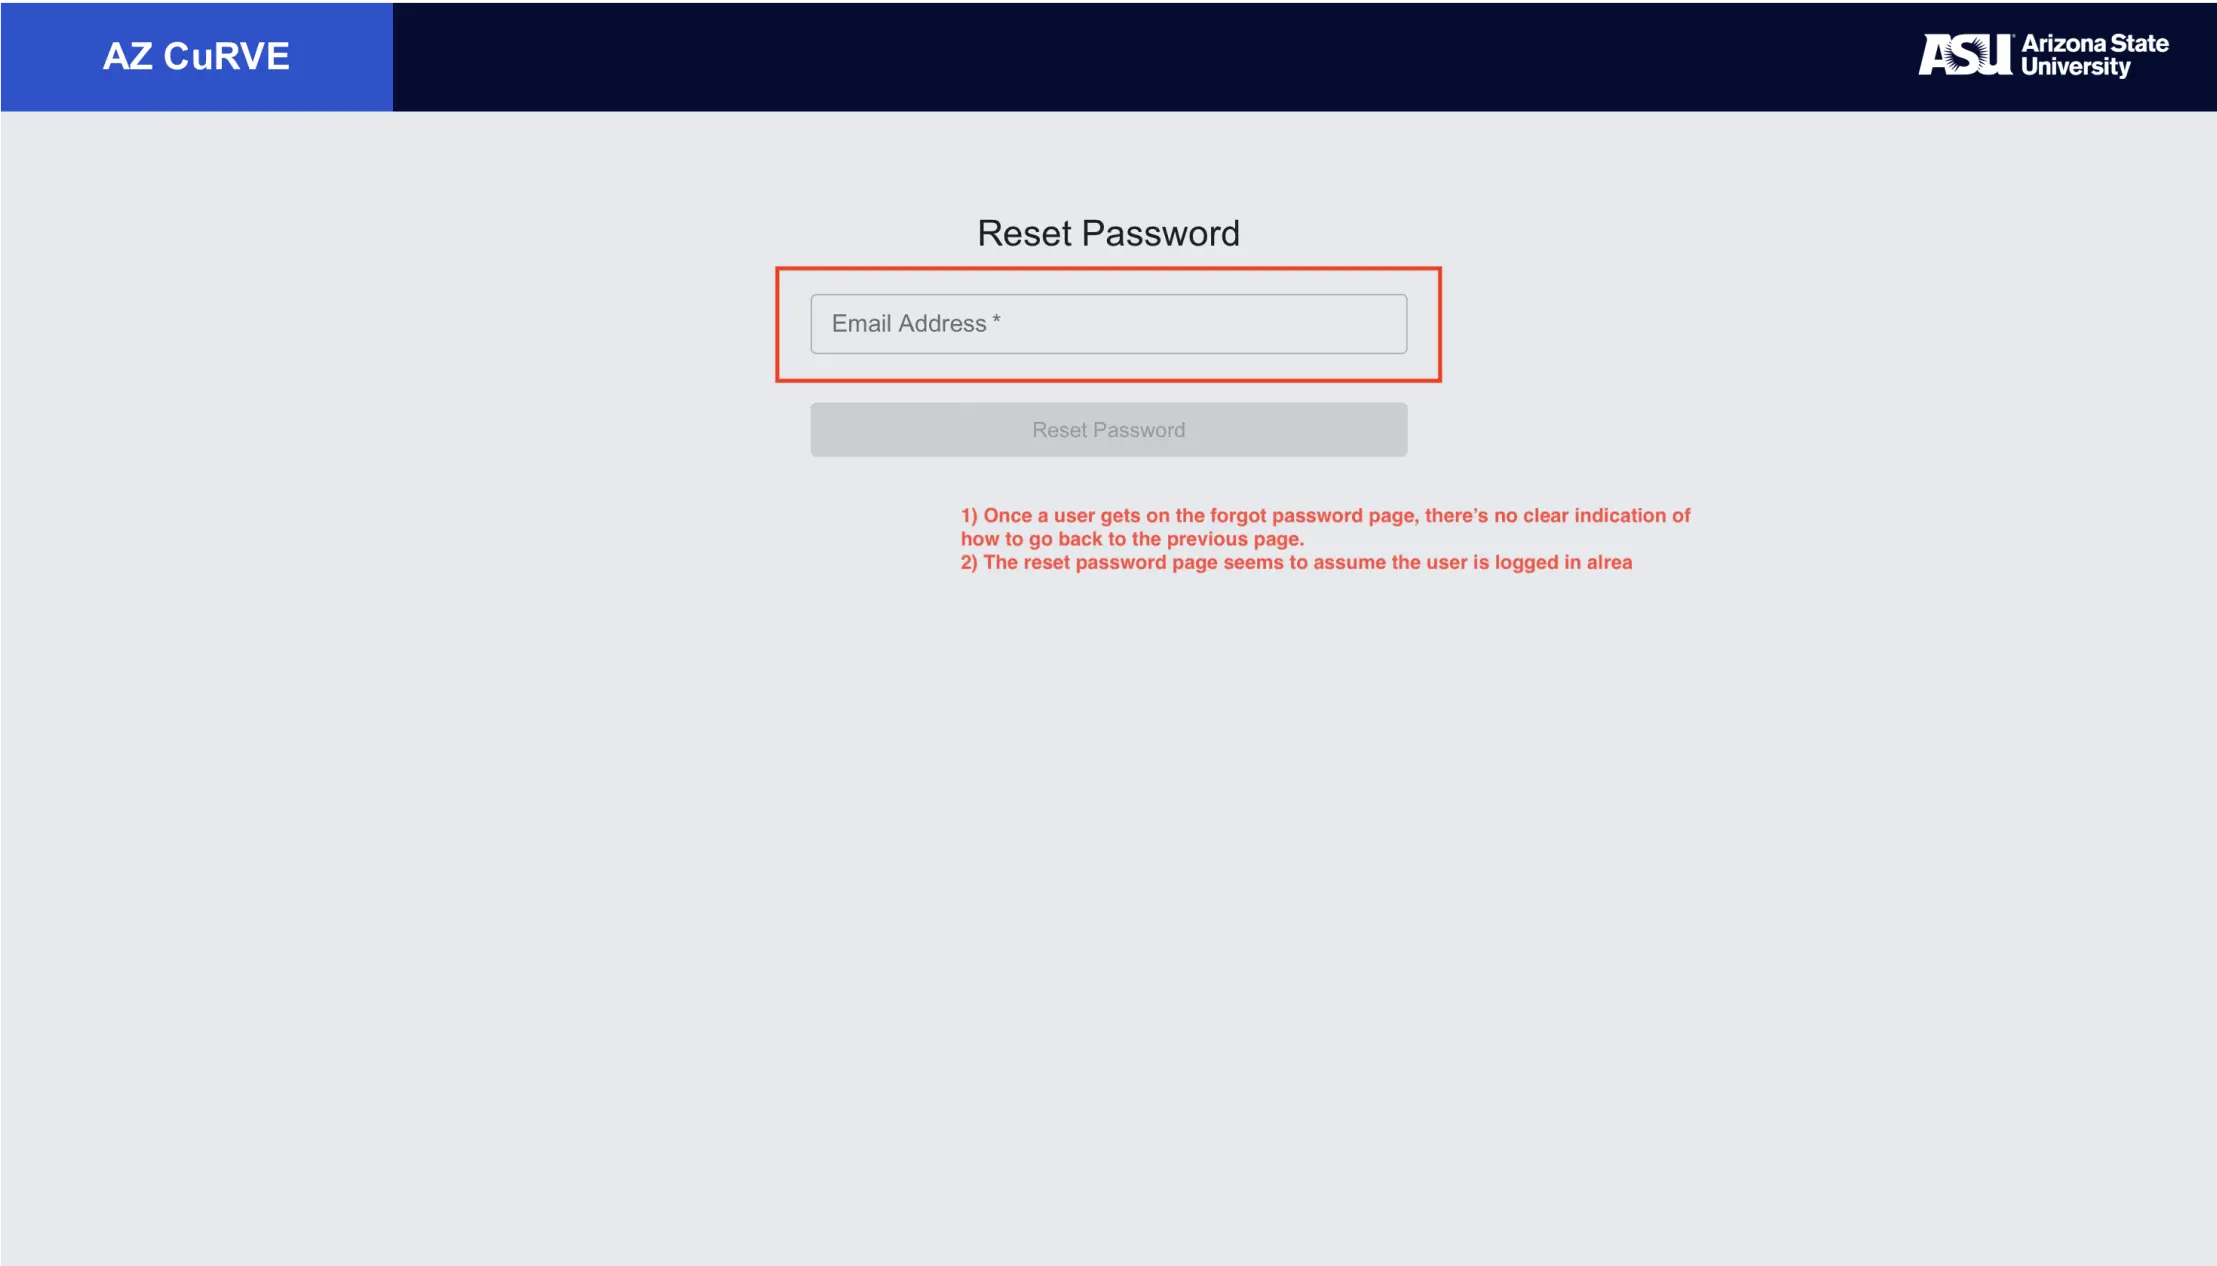
Poor navigation , difficult to access some functionalities of the tool. No clear back button on some of the pages
No proper consistency in the layout which makes it an uncomfortable experience to read with no definitive pattern
The website is not at all responsive - there were major distortions across web, tablet and mobile views
Not very good onboarding, I had no idea what the different scenarios are, or guide on where to find the information I seek
Comparative Analysis
My team was assigned to research on the other technical user groups. For this analysis, we compared against these tools;
The table below provides a list of the evaluated competitors with their profile, main audience, and key strengths:
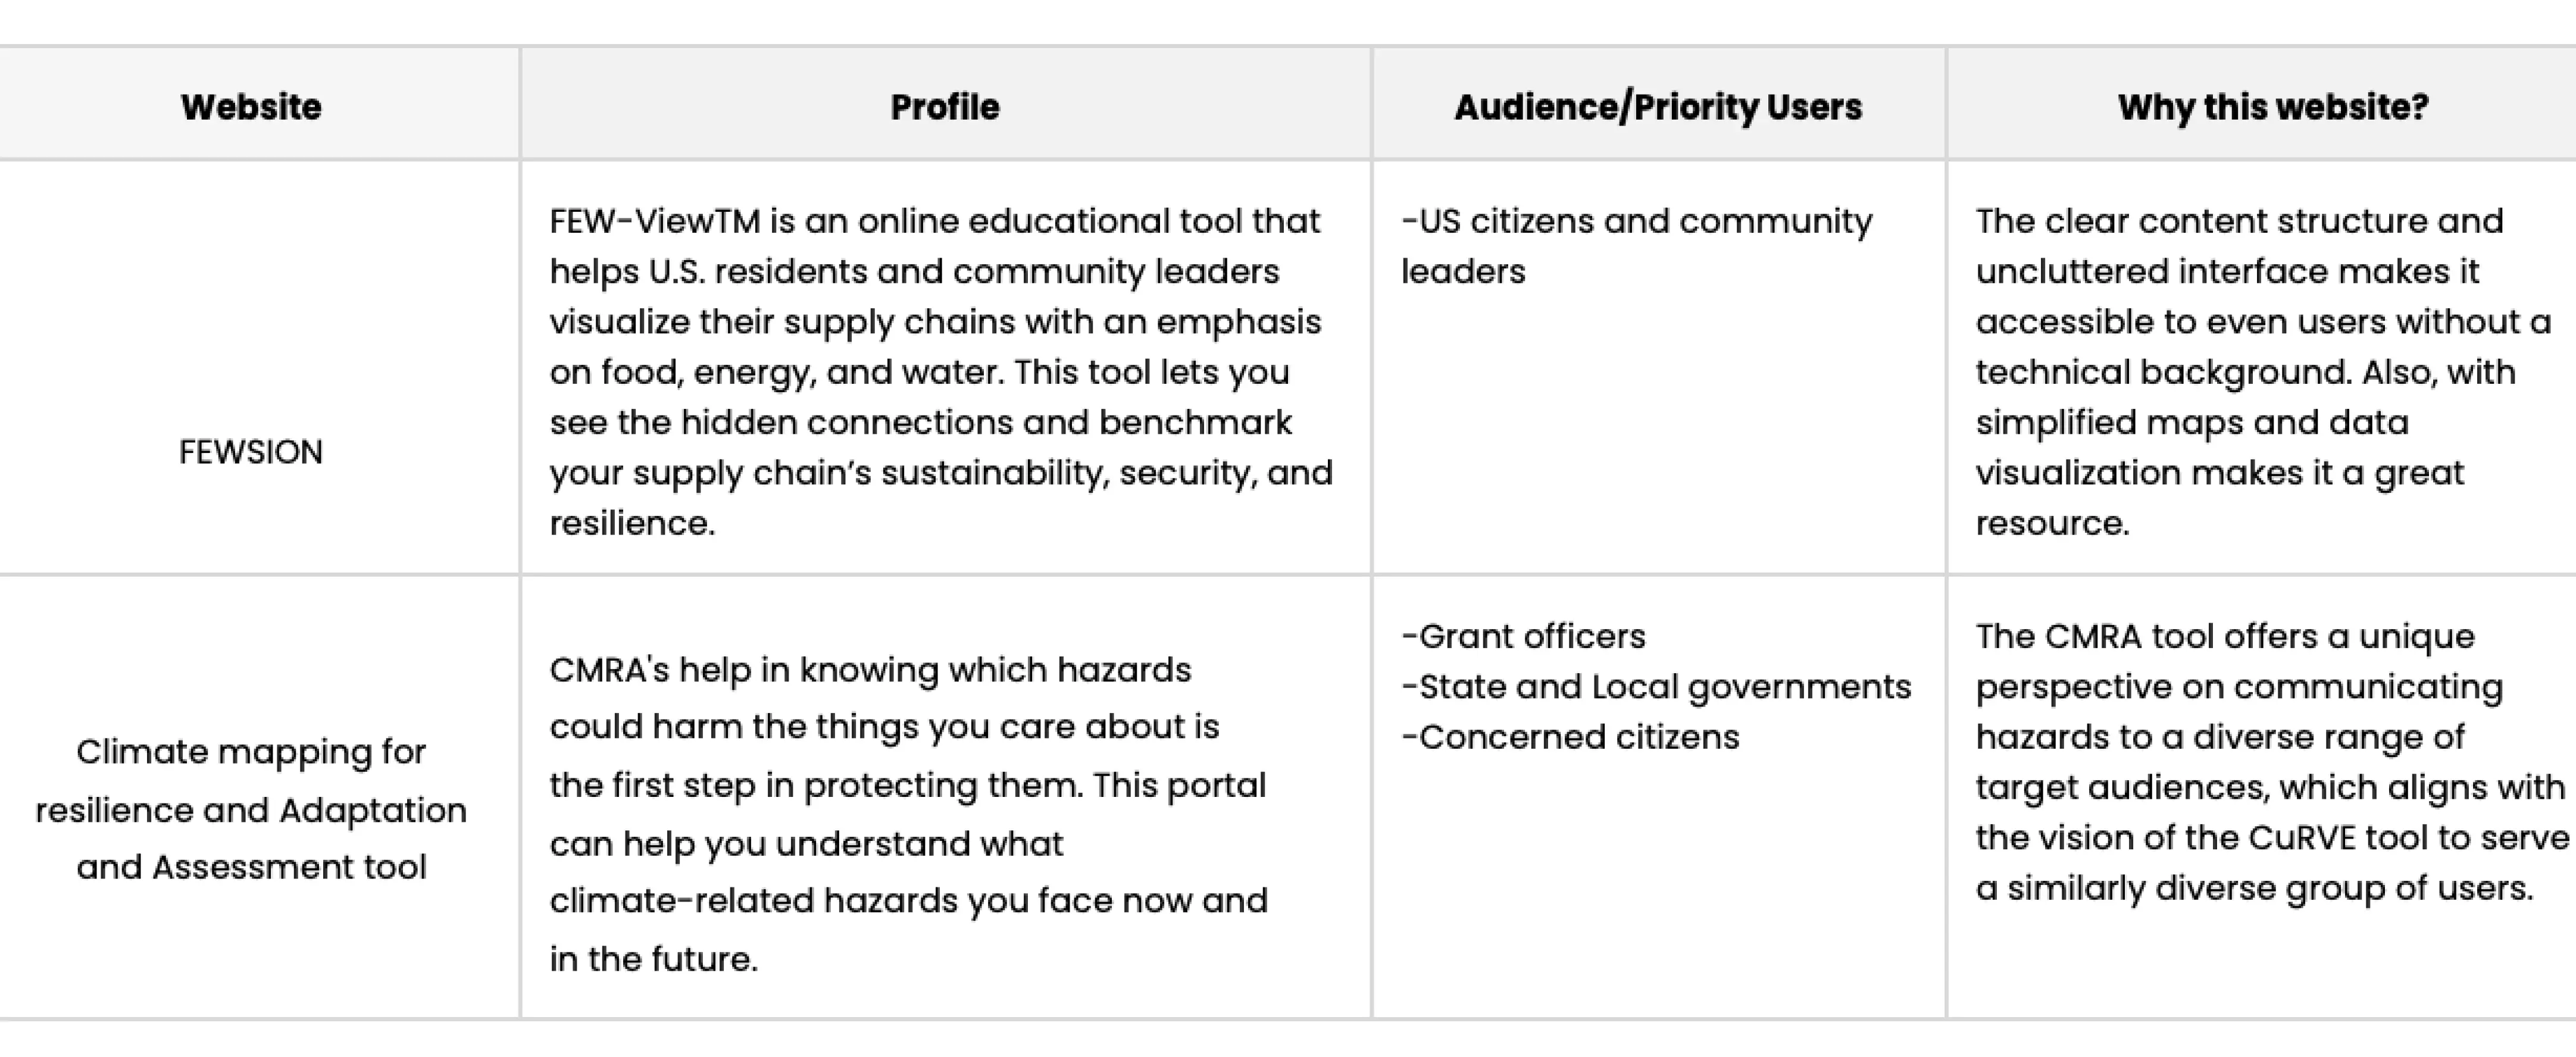
Find a detailed view of the analysis here 🔗 Comparative analysis
User Research
We carried out qualitative user research, in the form of a user interview. For this, we came up with interview questions, script and recruitment email for our prospective participants. At this point our target audience group were journalists who write about water issues in Arizona.
From the interview, we had a comprehensive and detailed analysis of the situation, shedding light on the different factors that have contributed to the crisis. The interview was insightful and thought provoking, it gave a clear understanding of the problem and what direction to follow.
After the completion of the interviews, we analyzed our findings to have a clearer understanding, and project insights from the sessions so far. Below is a summary of the findings.
🚀 Key Findings...
Many journalists who cover technical topics may not have a strong technical background in the subject matter they are reporting on. This lack of technical expertise potentially hinder their ability to comprehend complex information related to the issue, which could impact the accuracy and effectiveness of their reporting
Journalists who analyze data need to provide context and relatable benchmarks to their audiences to make the data more useful and understandable. So, it is crucial that the design display data with a useful comparative benchmark that enables them to contextualize it in a manner that resonates with their audience.
Simplification of the data and colour coding it to follow some real world conventions gives it easier accessibility especially to this user group.
One of the major challenges faced by this user group is the need to simplify complicated concepts and graphs to make them more easily understandable to their audience.
Developing persona
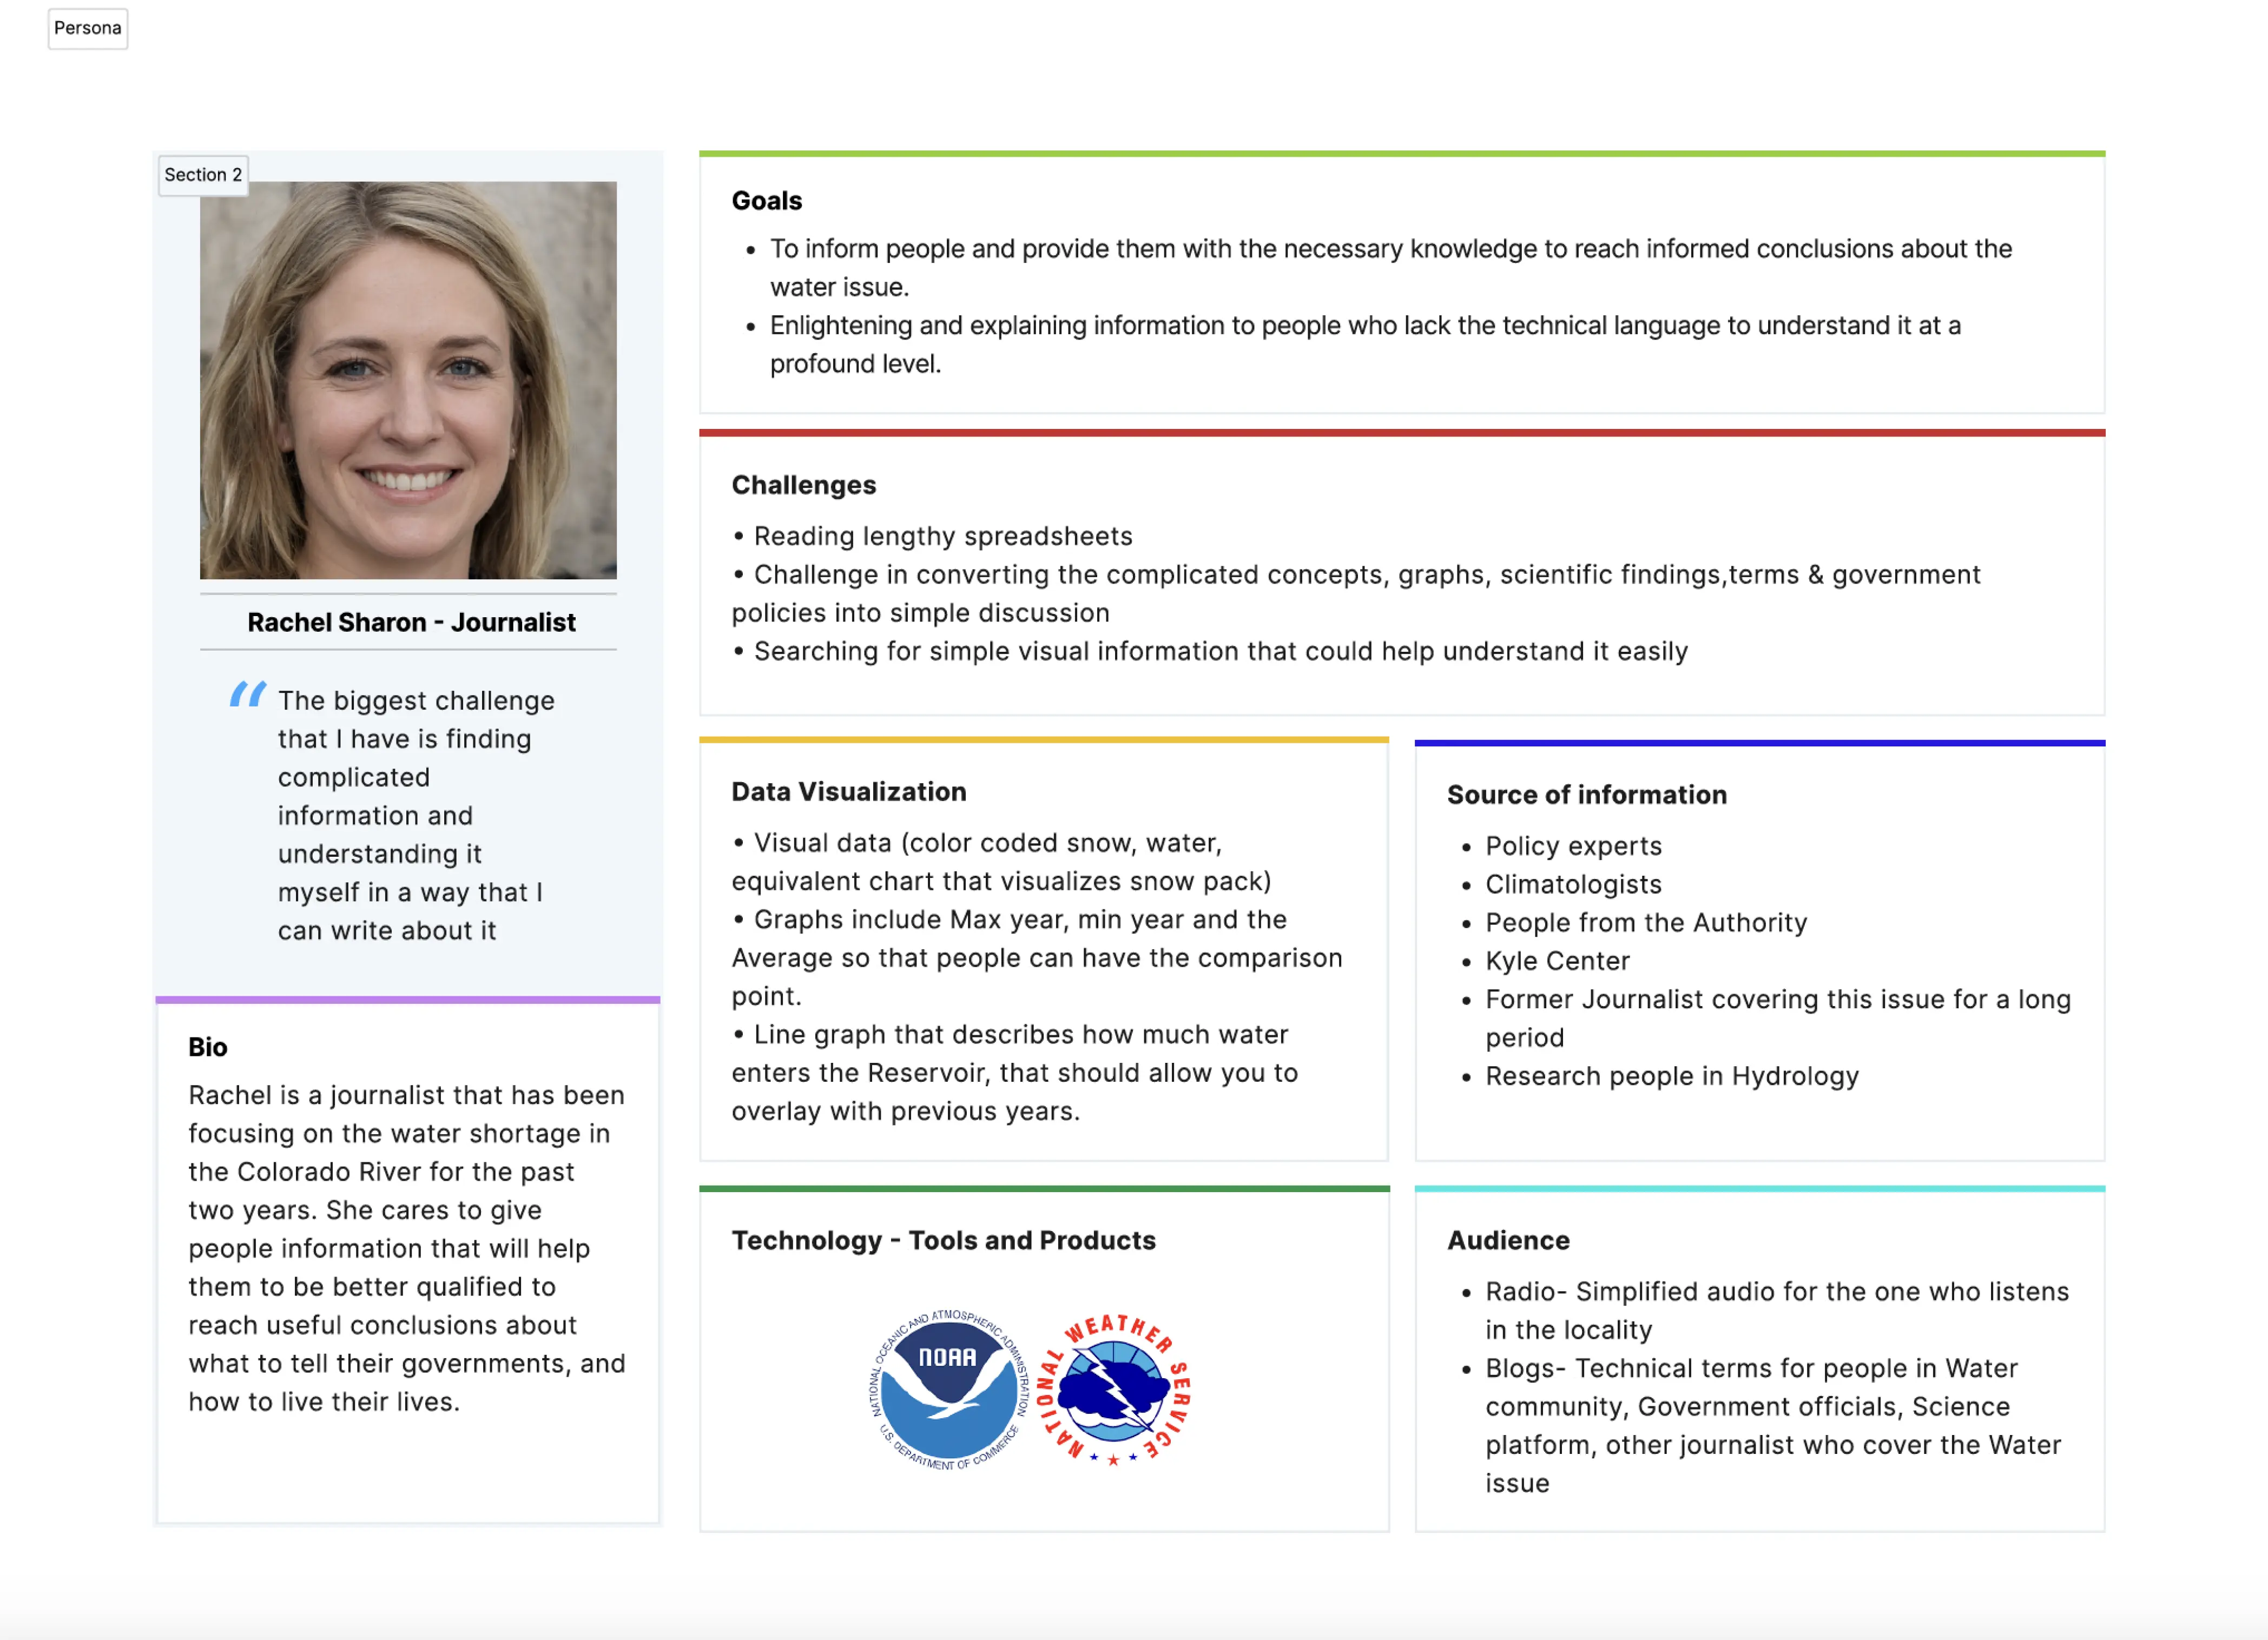
Starting out the project, we had three broad user groups. My team is focusing on the Non-technical user group. Consolidating on the user research done so far and goals the stakeholders are trying to achieve. We came up with a persona depicting who our target user is. After a couple of review and improvement, we finalized on Rachel 😁.
Meet Rachel - 👋
Taskflows
As we progressed through the project, we aimed to create a more holistic experience for our target users. To achieve this, we broke down their goals into tasks and determined how they can seamlessly accomplish them.
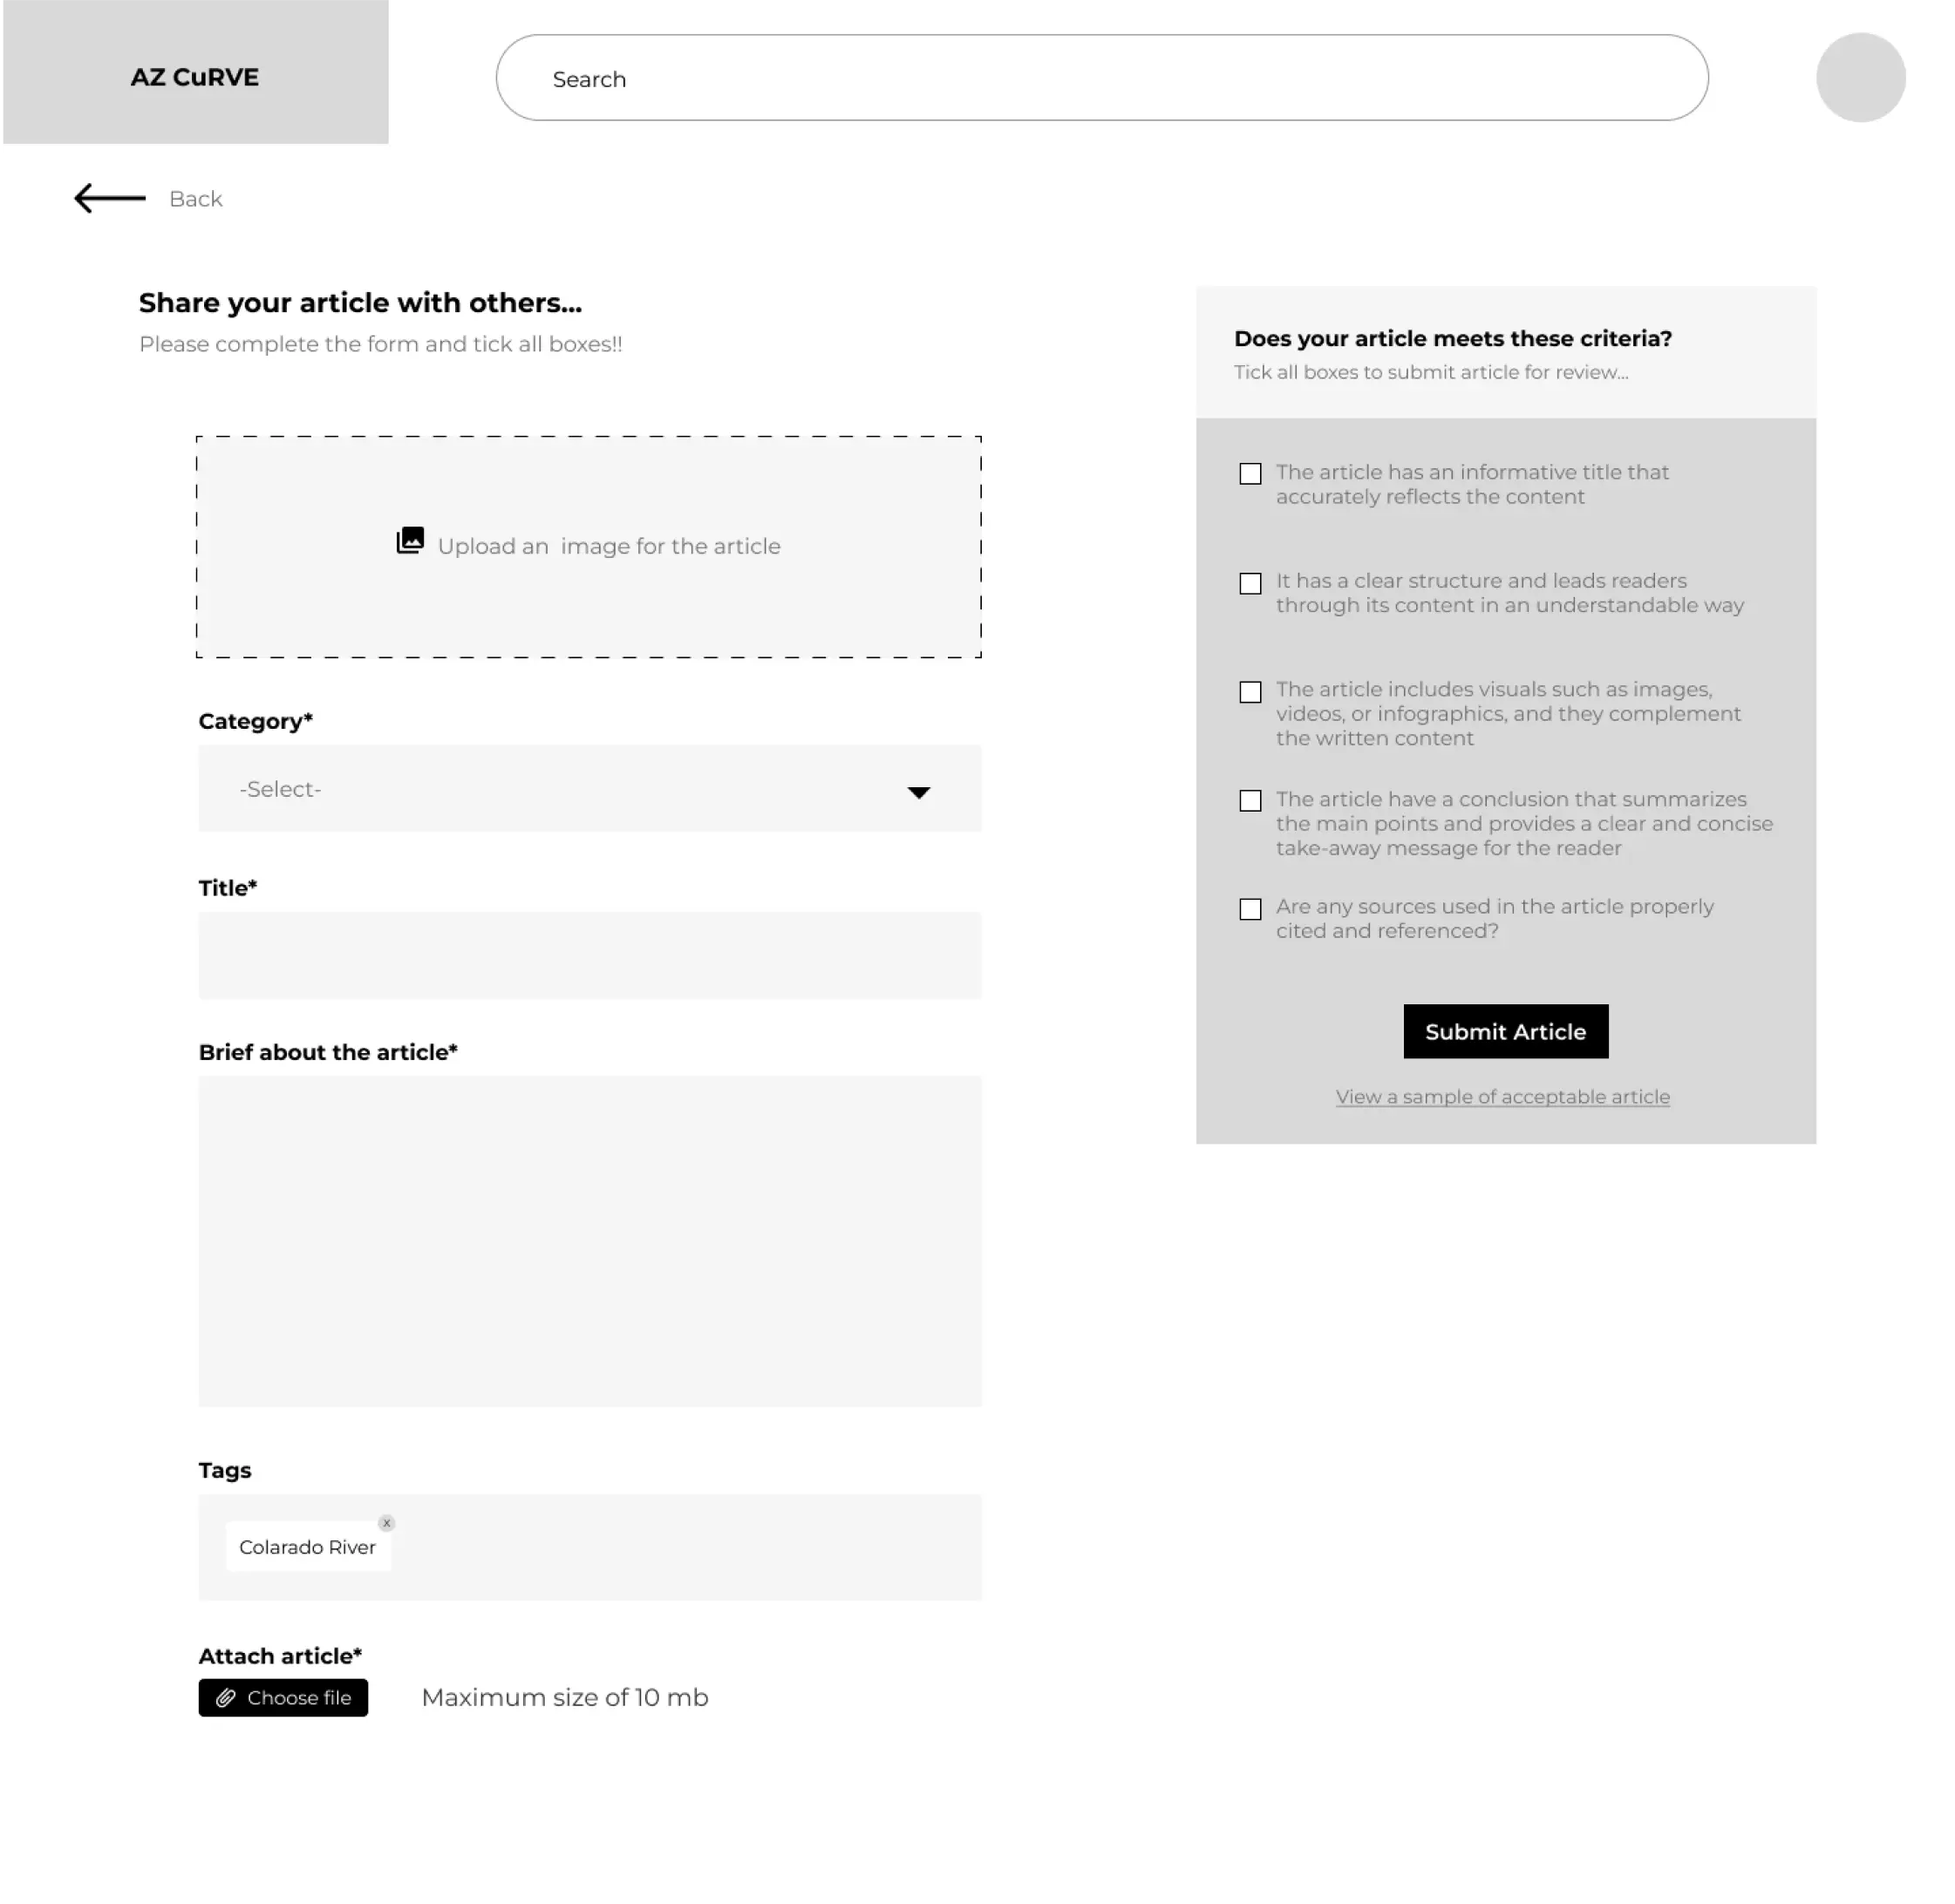
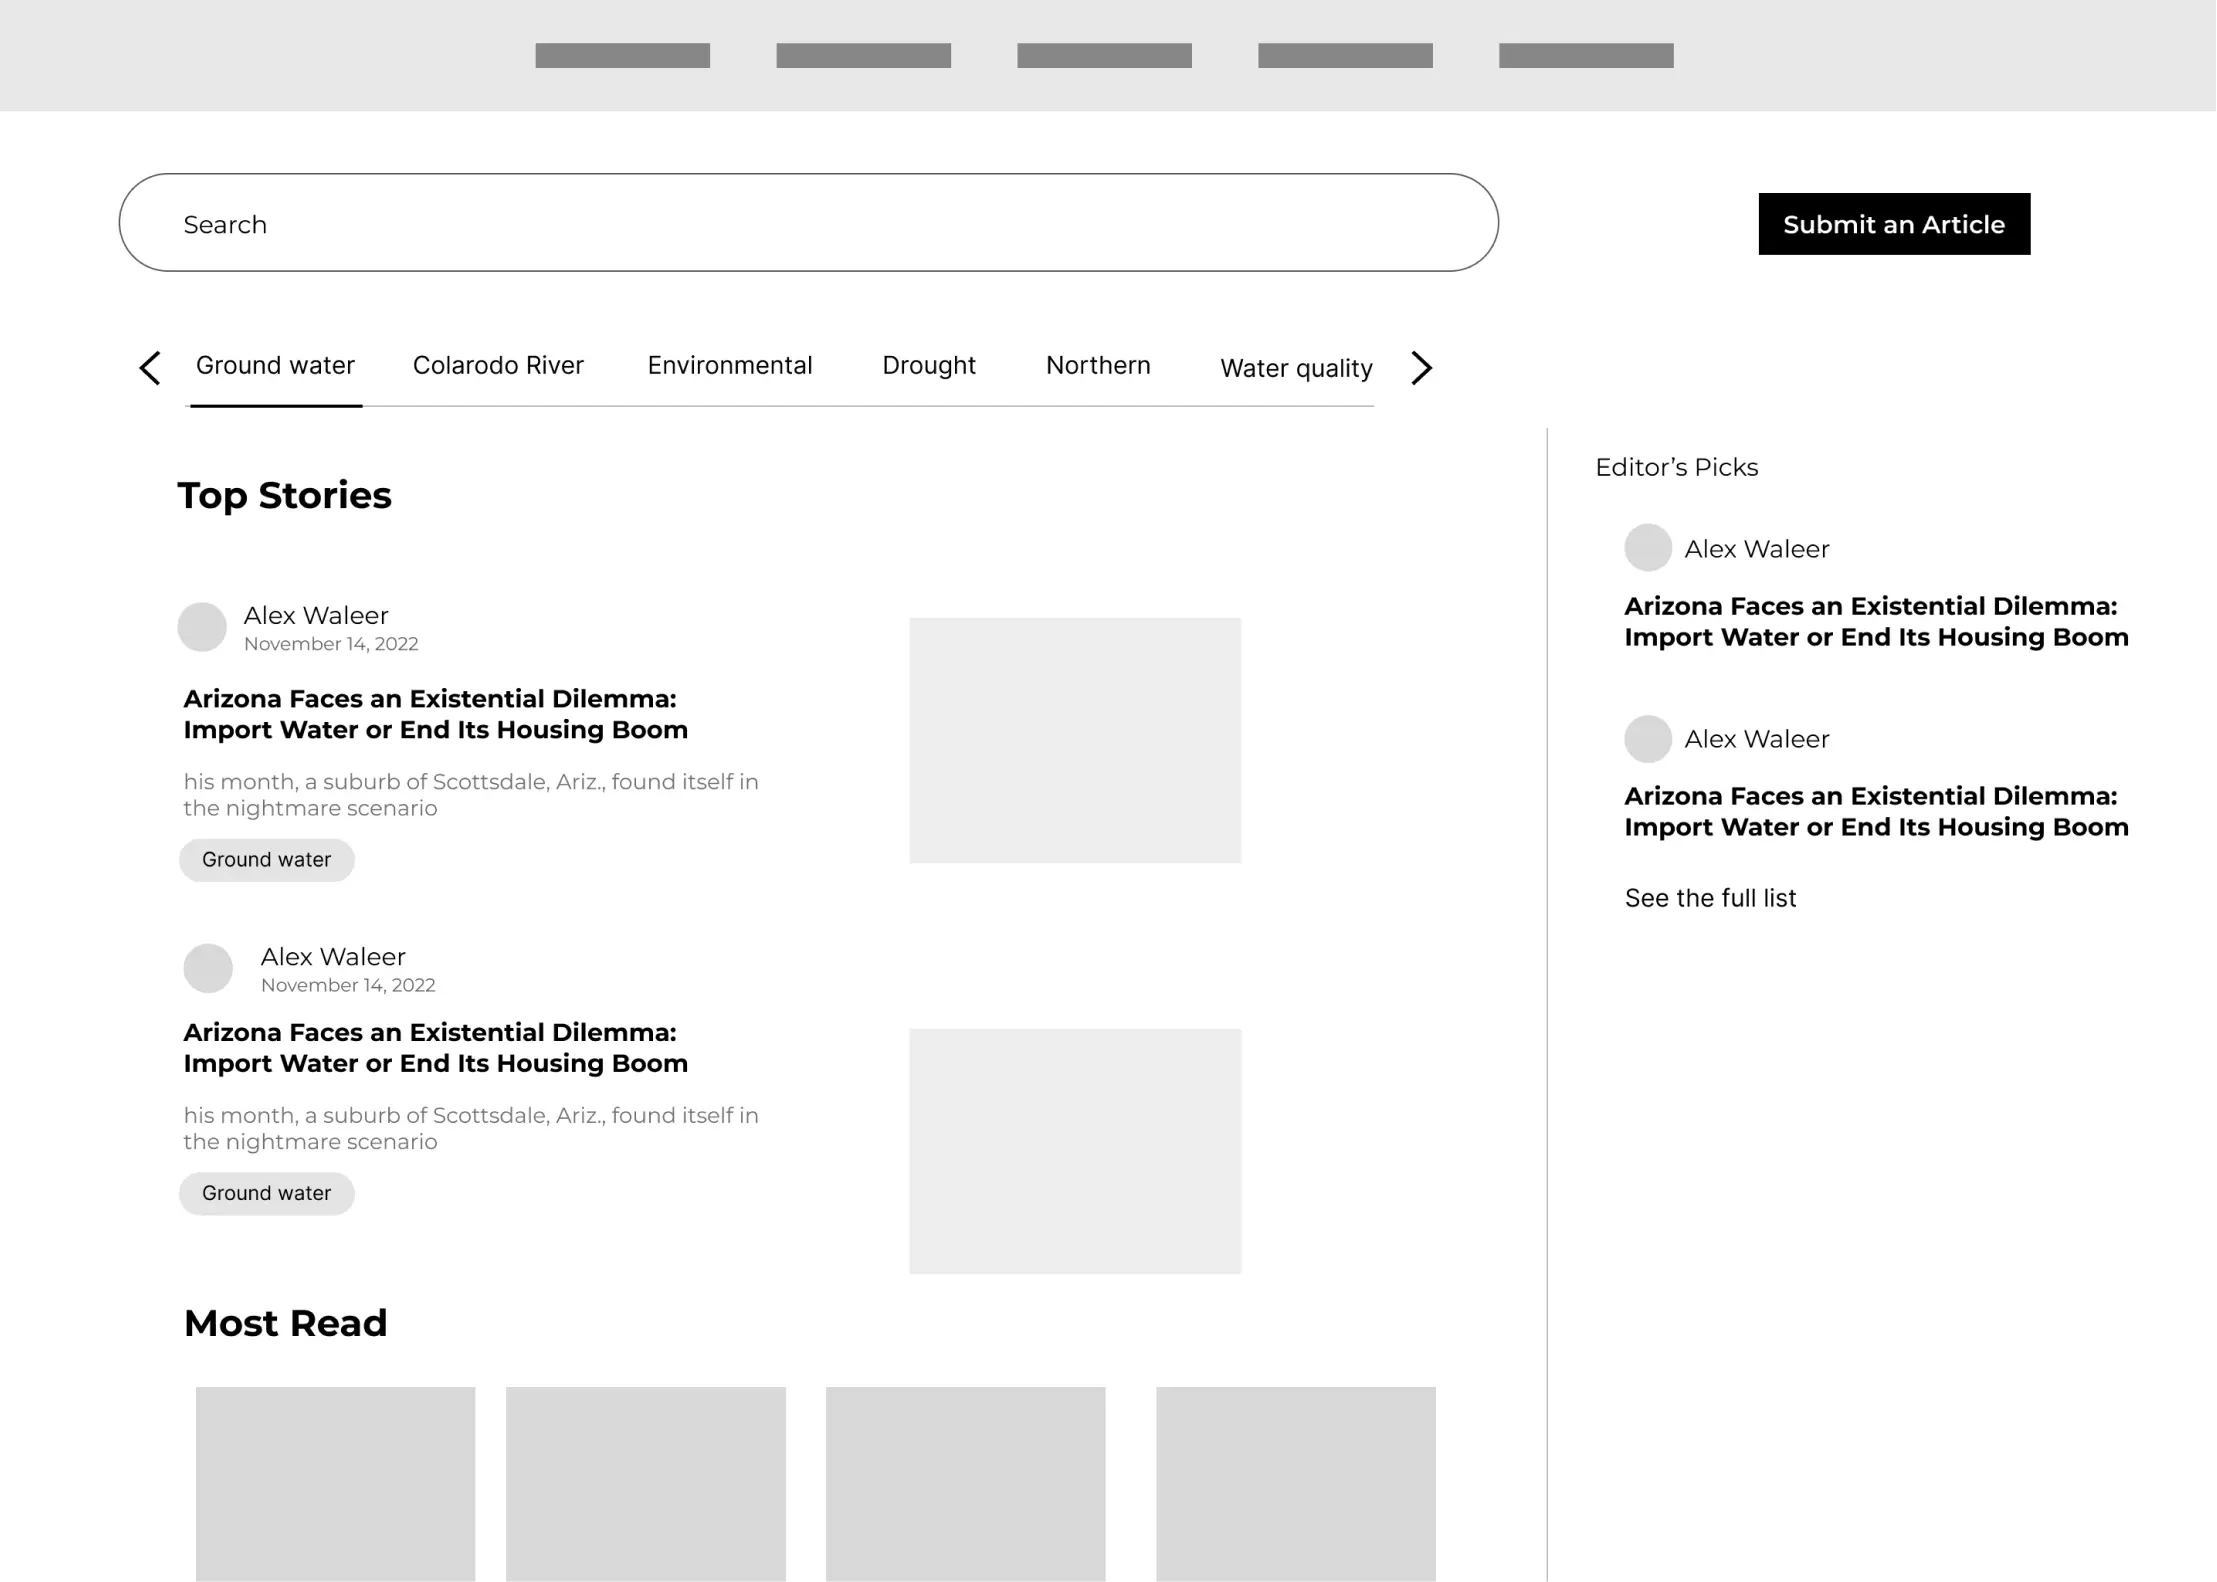
1. Accessing/ Submitting an Article

2. Building Scenarios

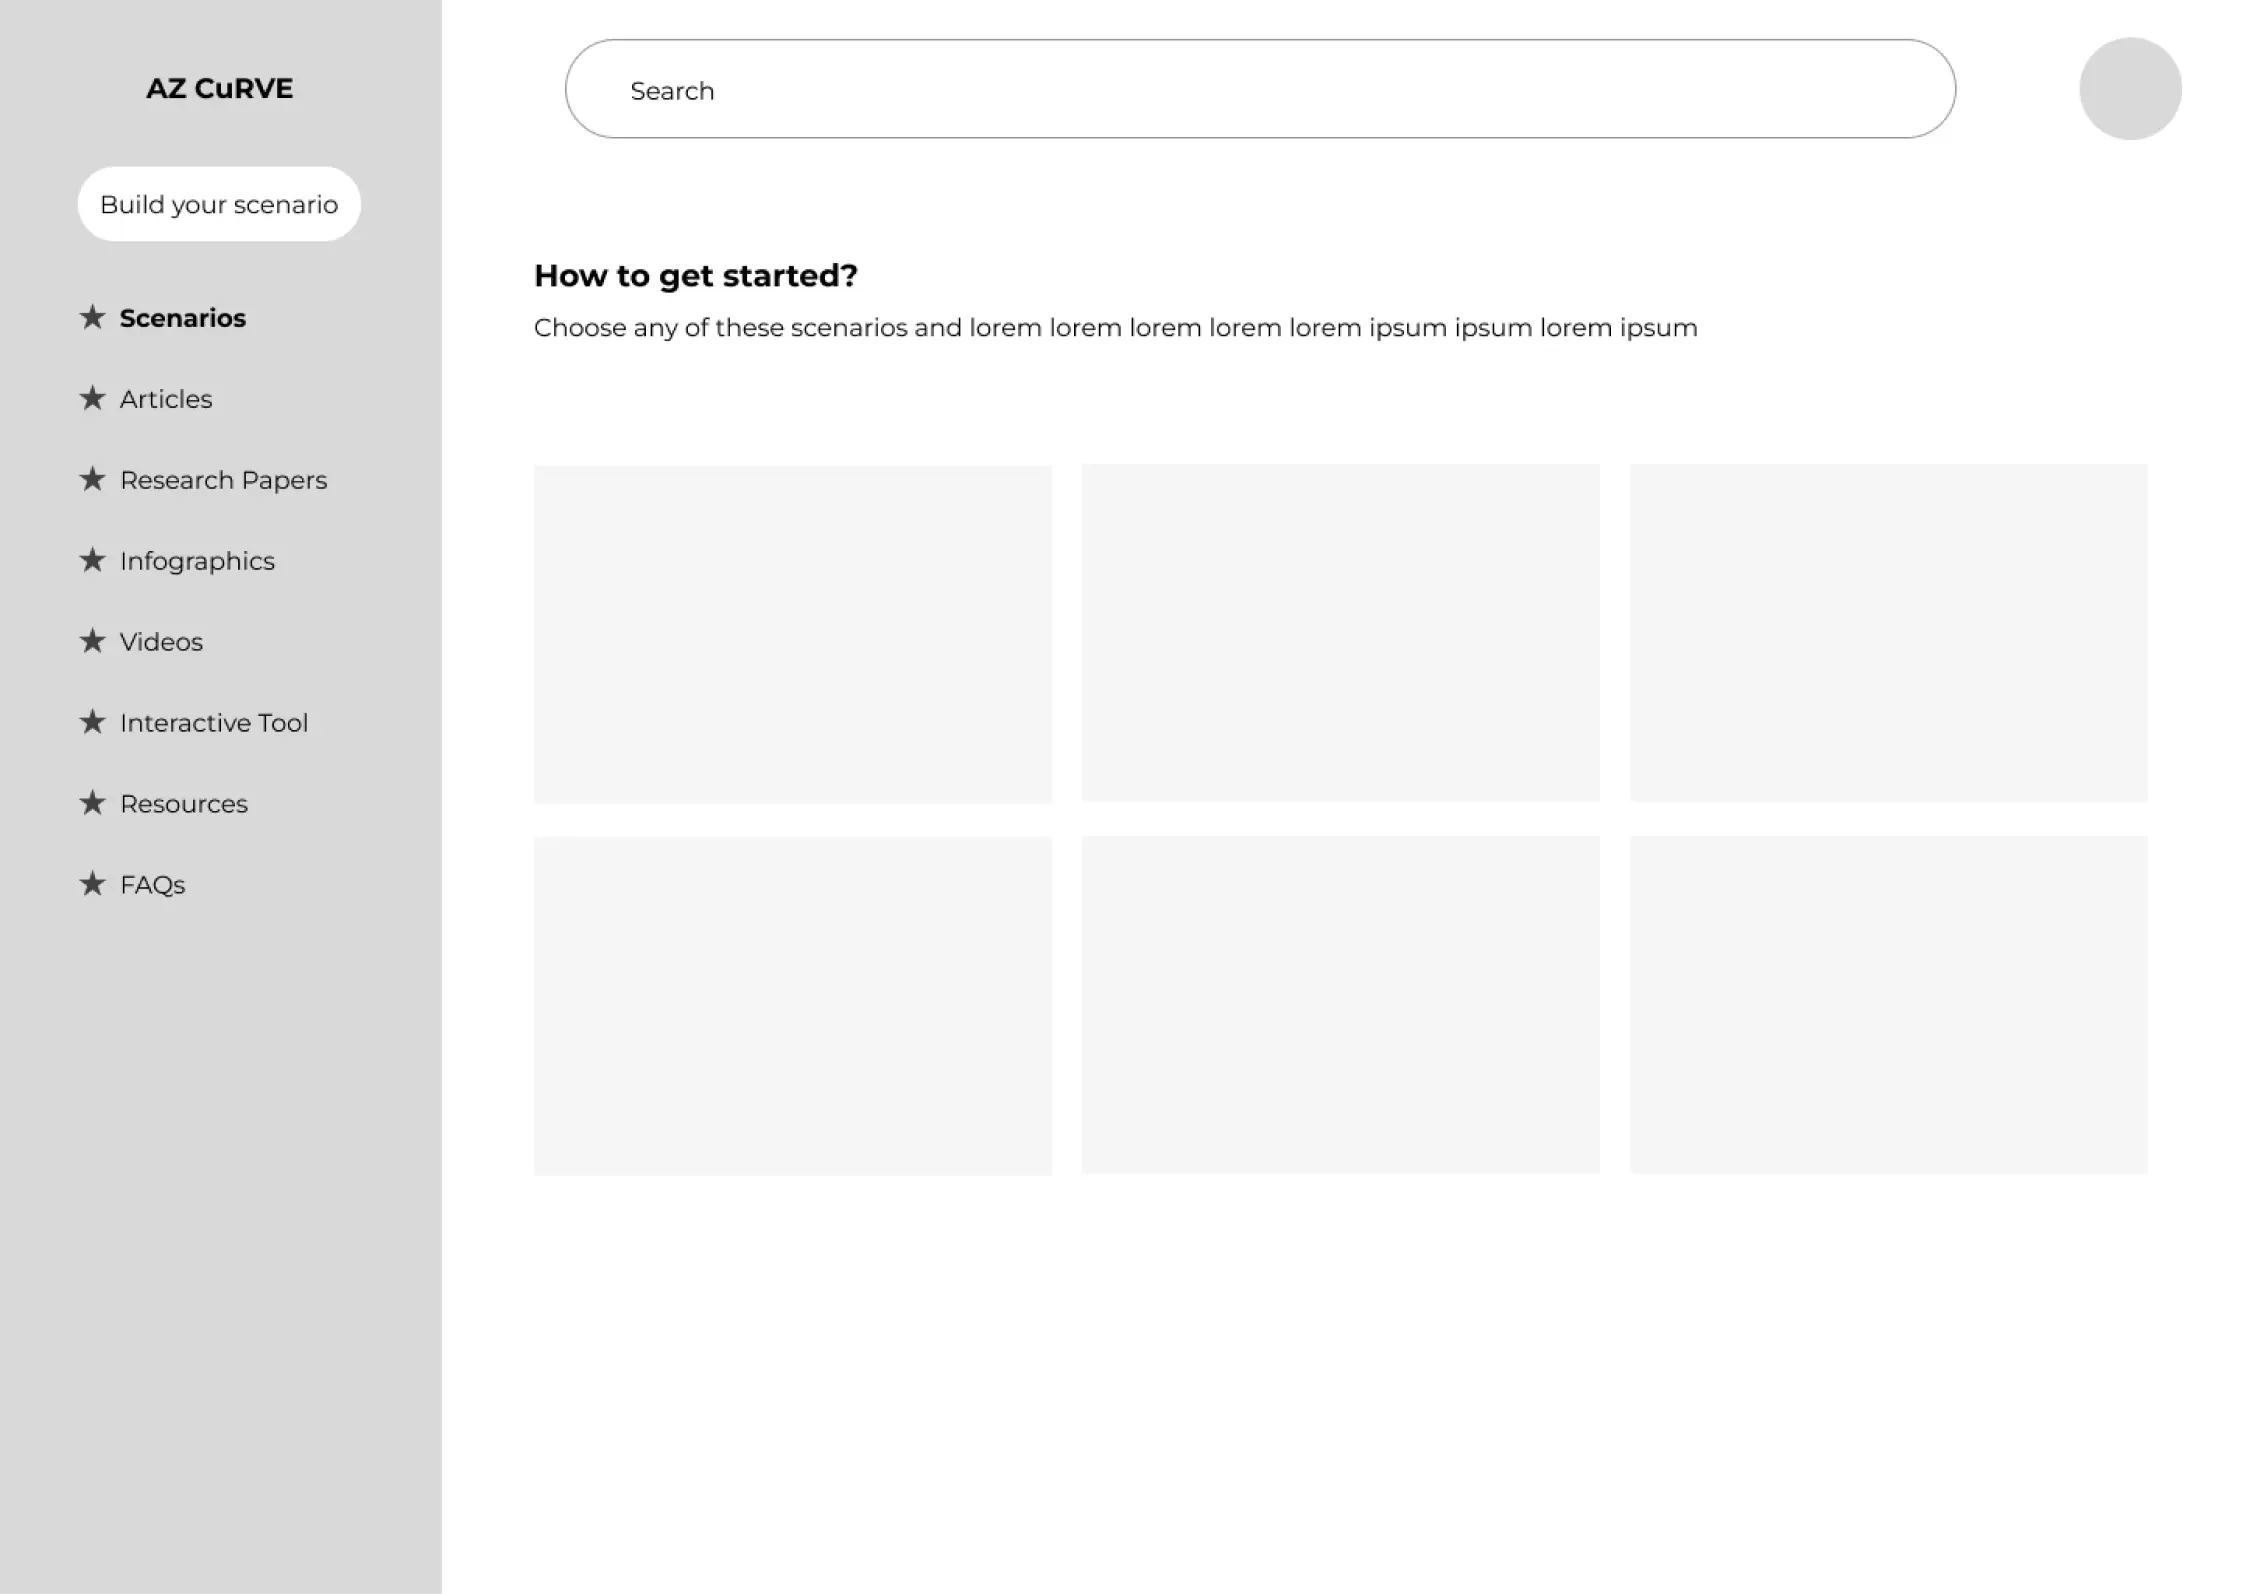
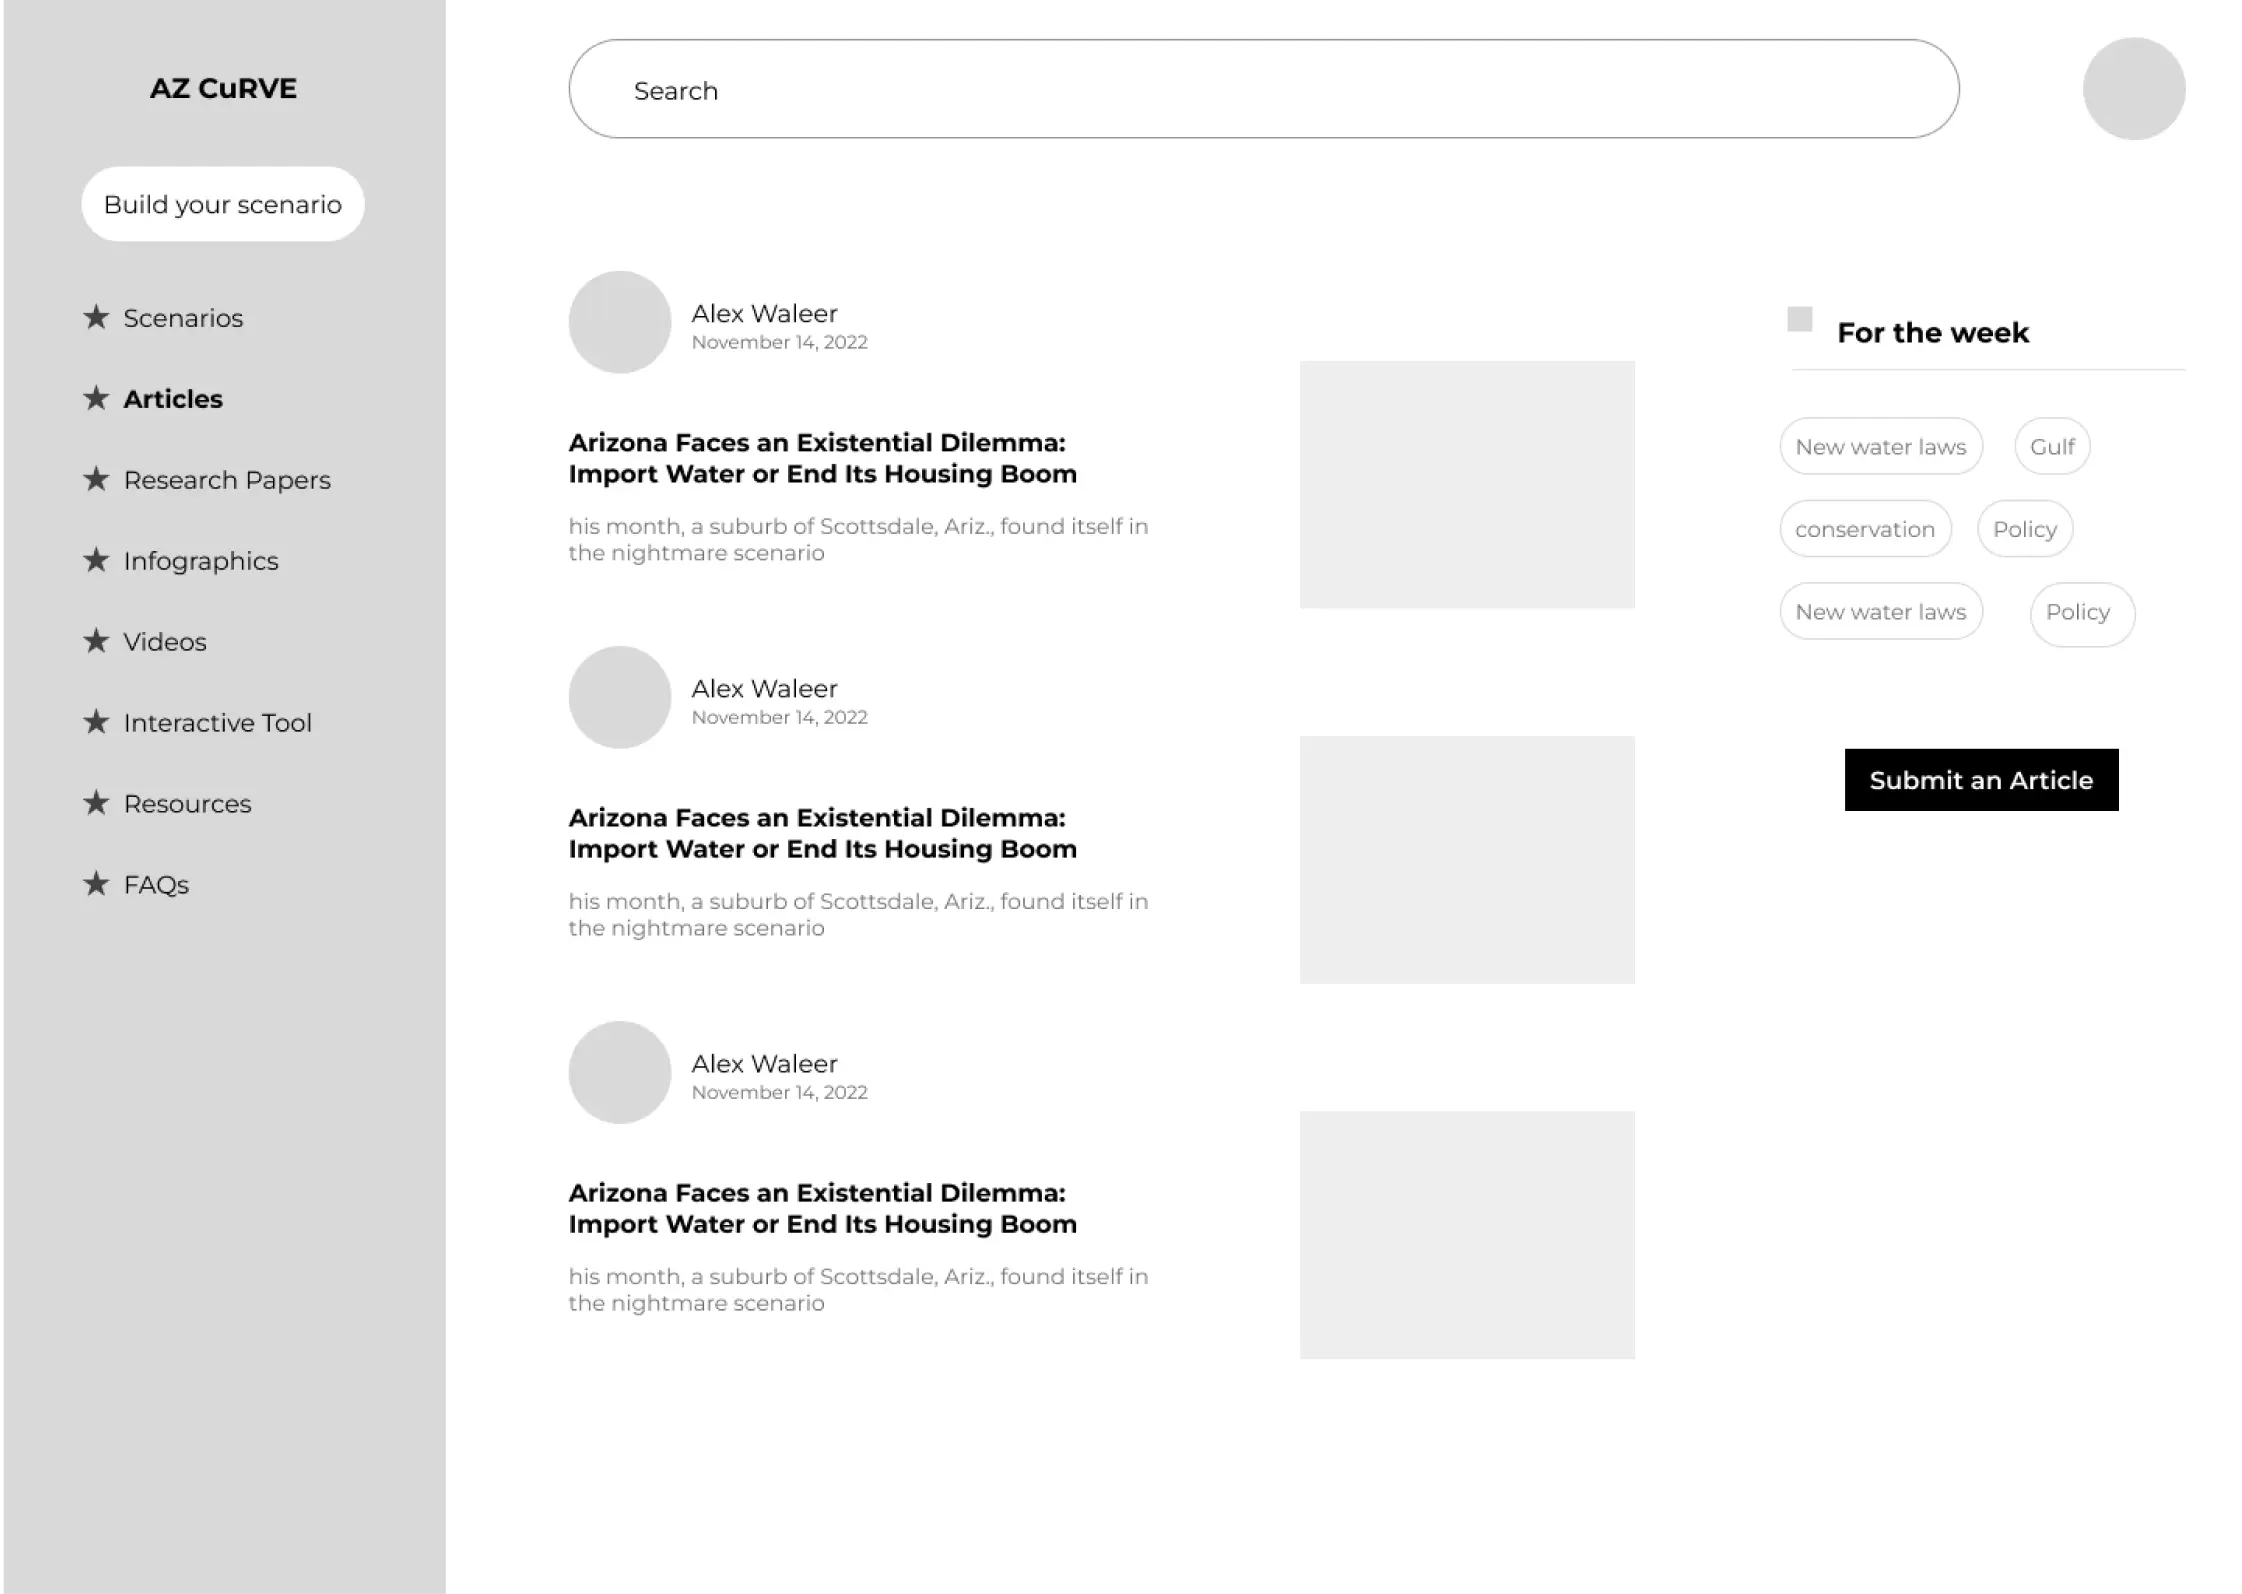
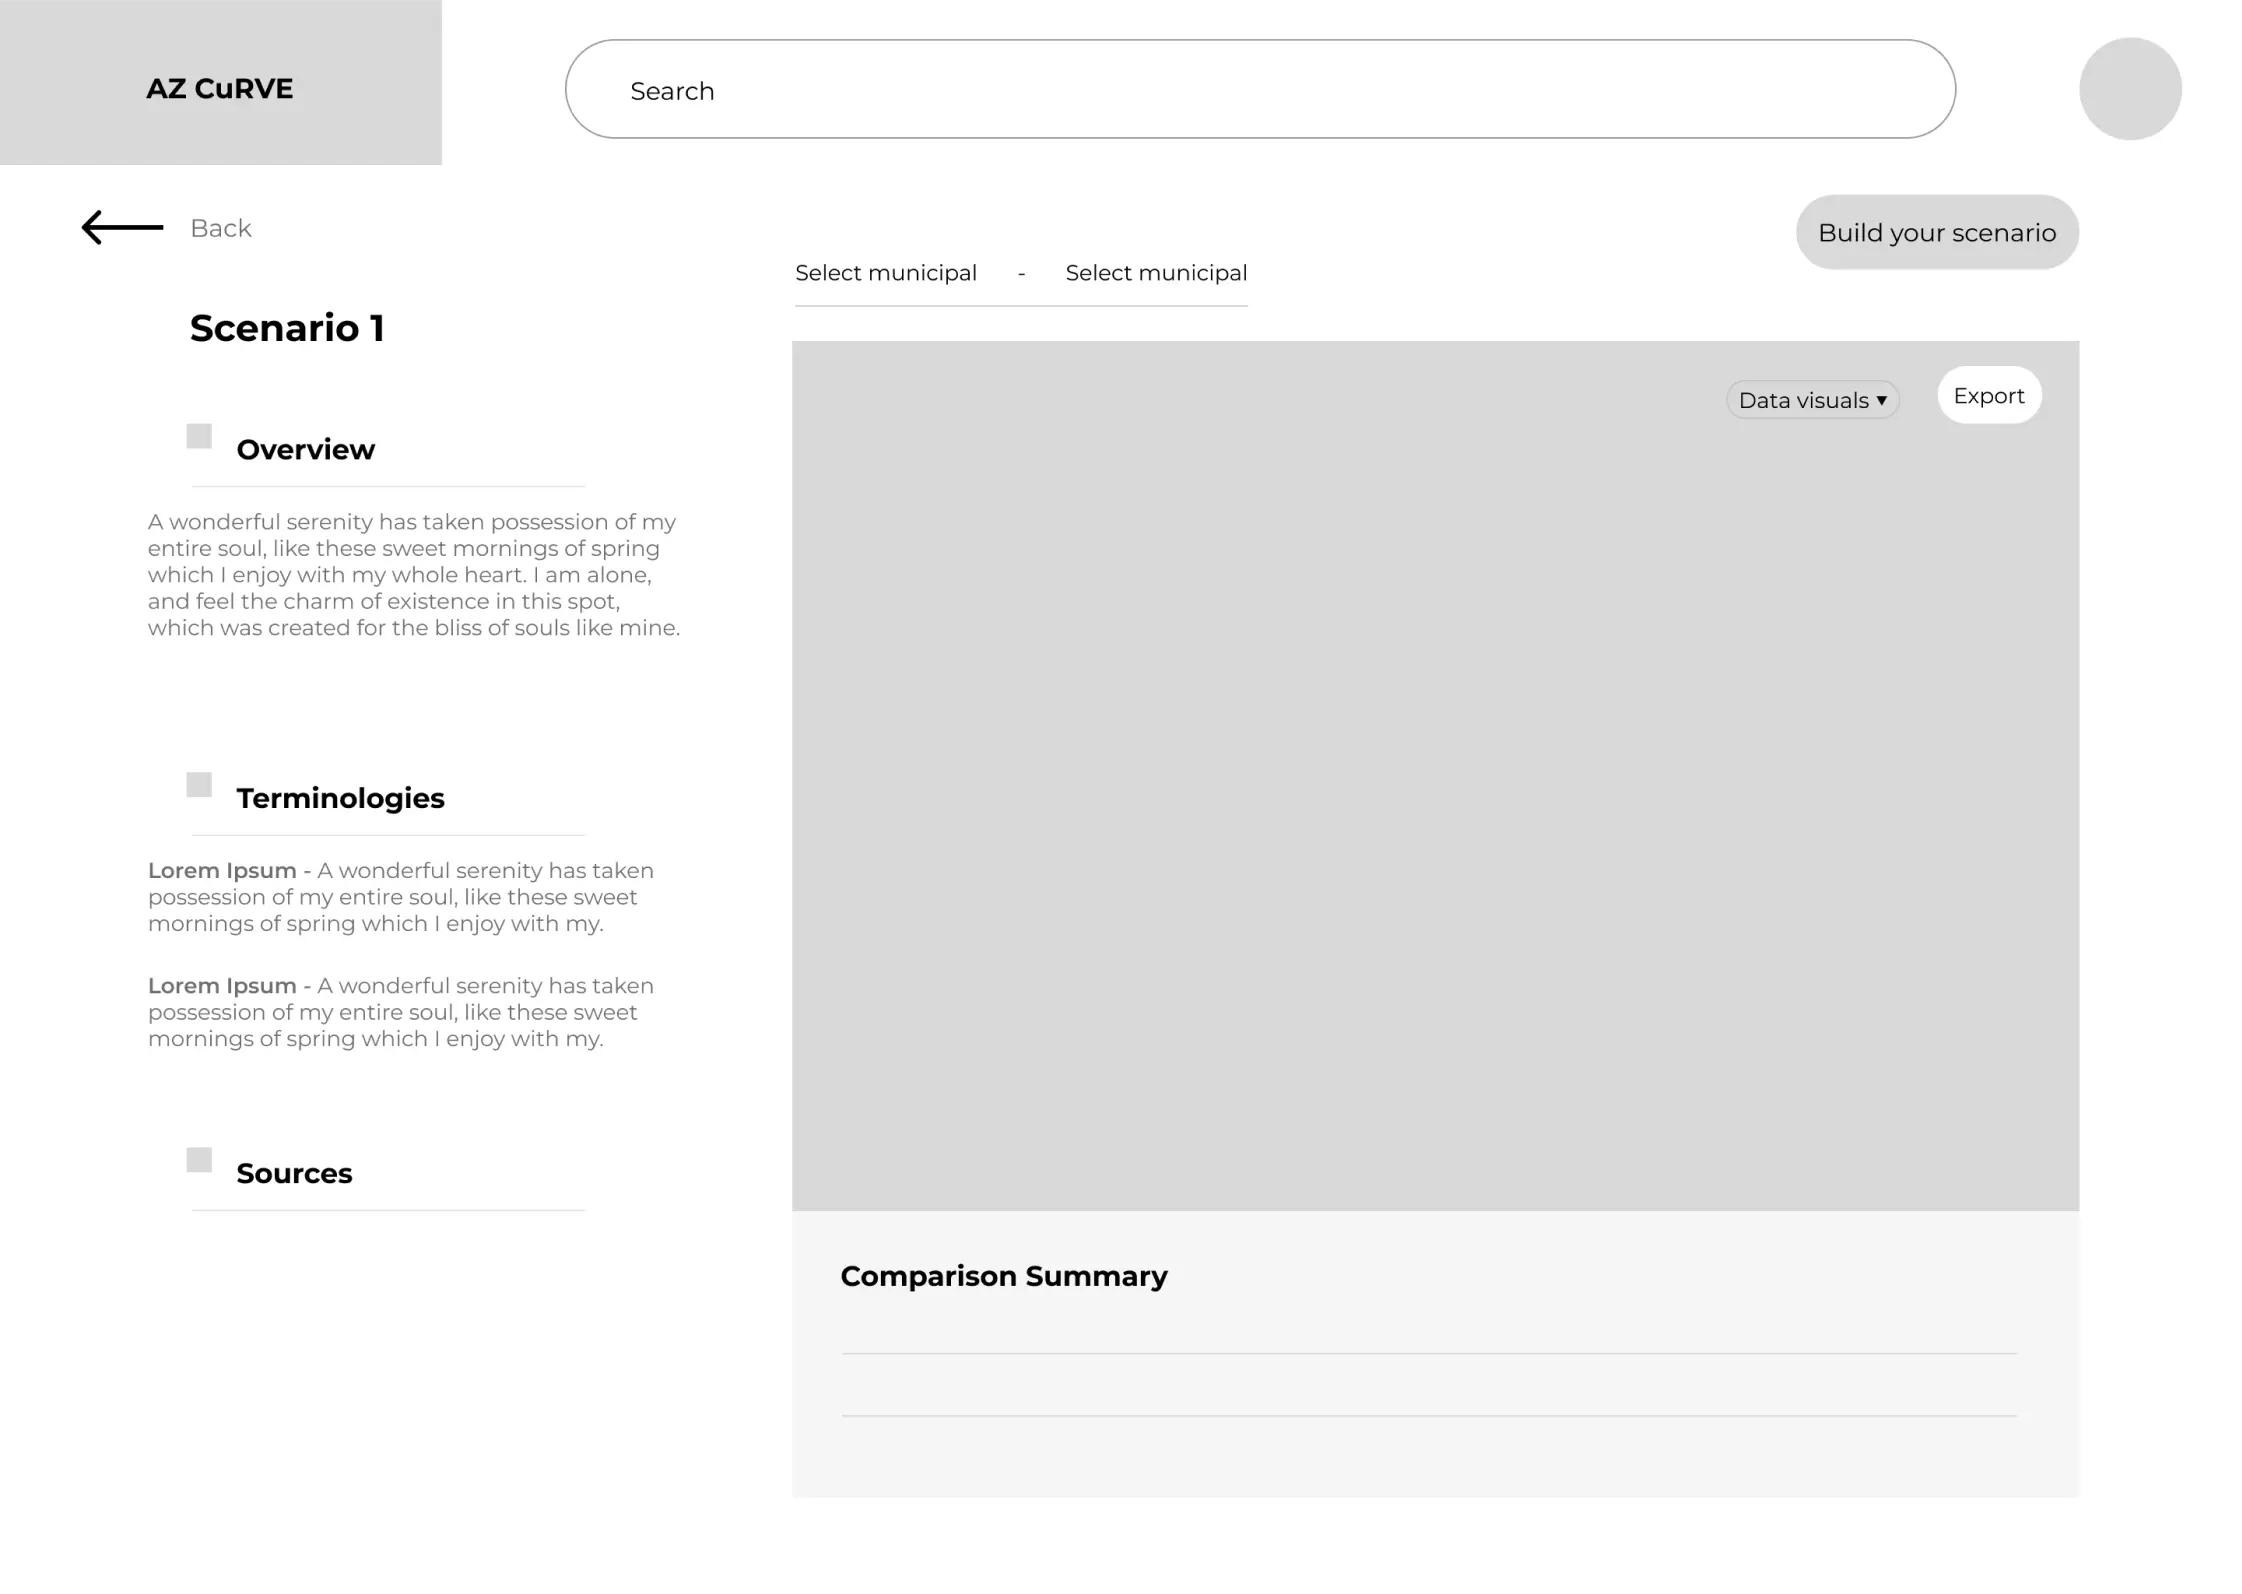
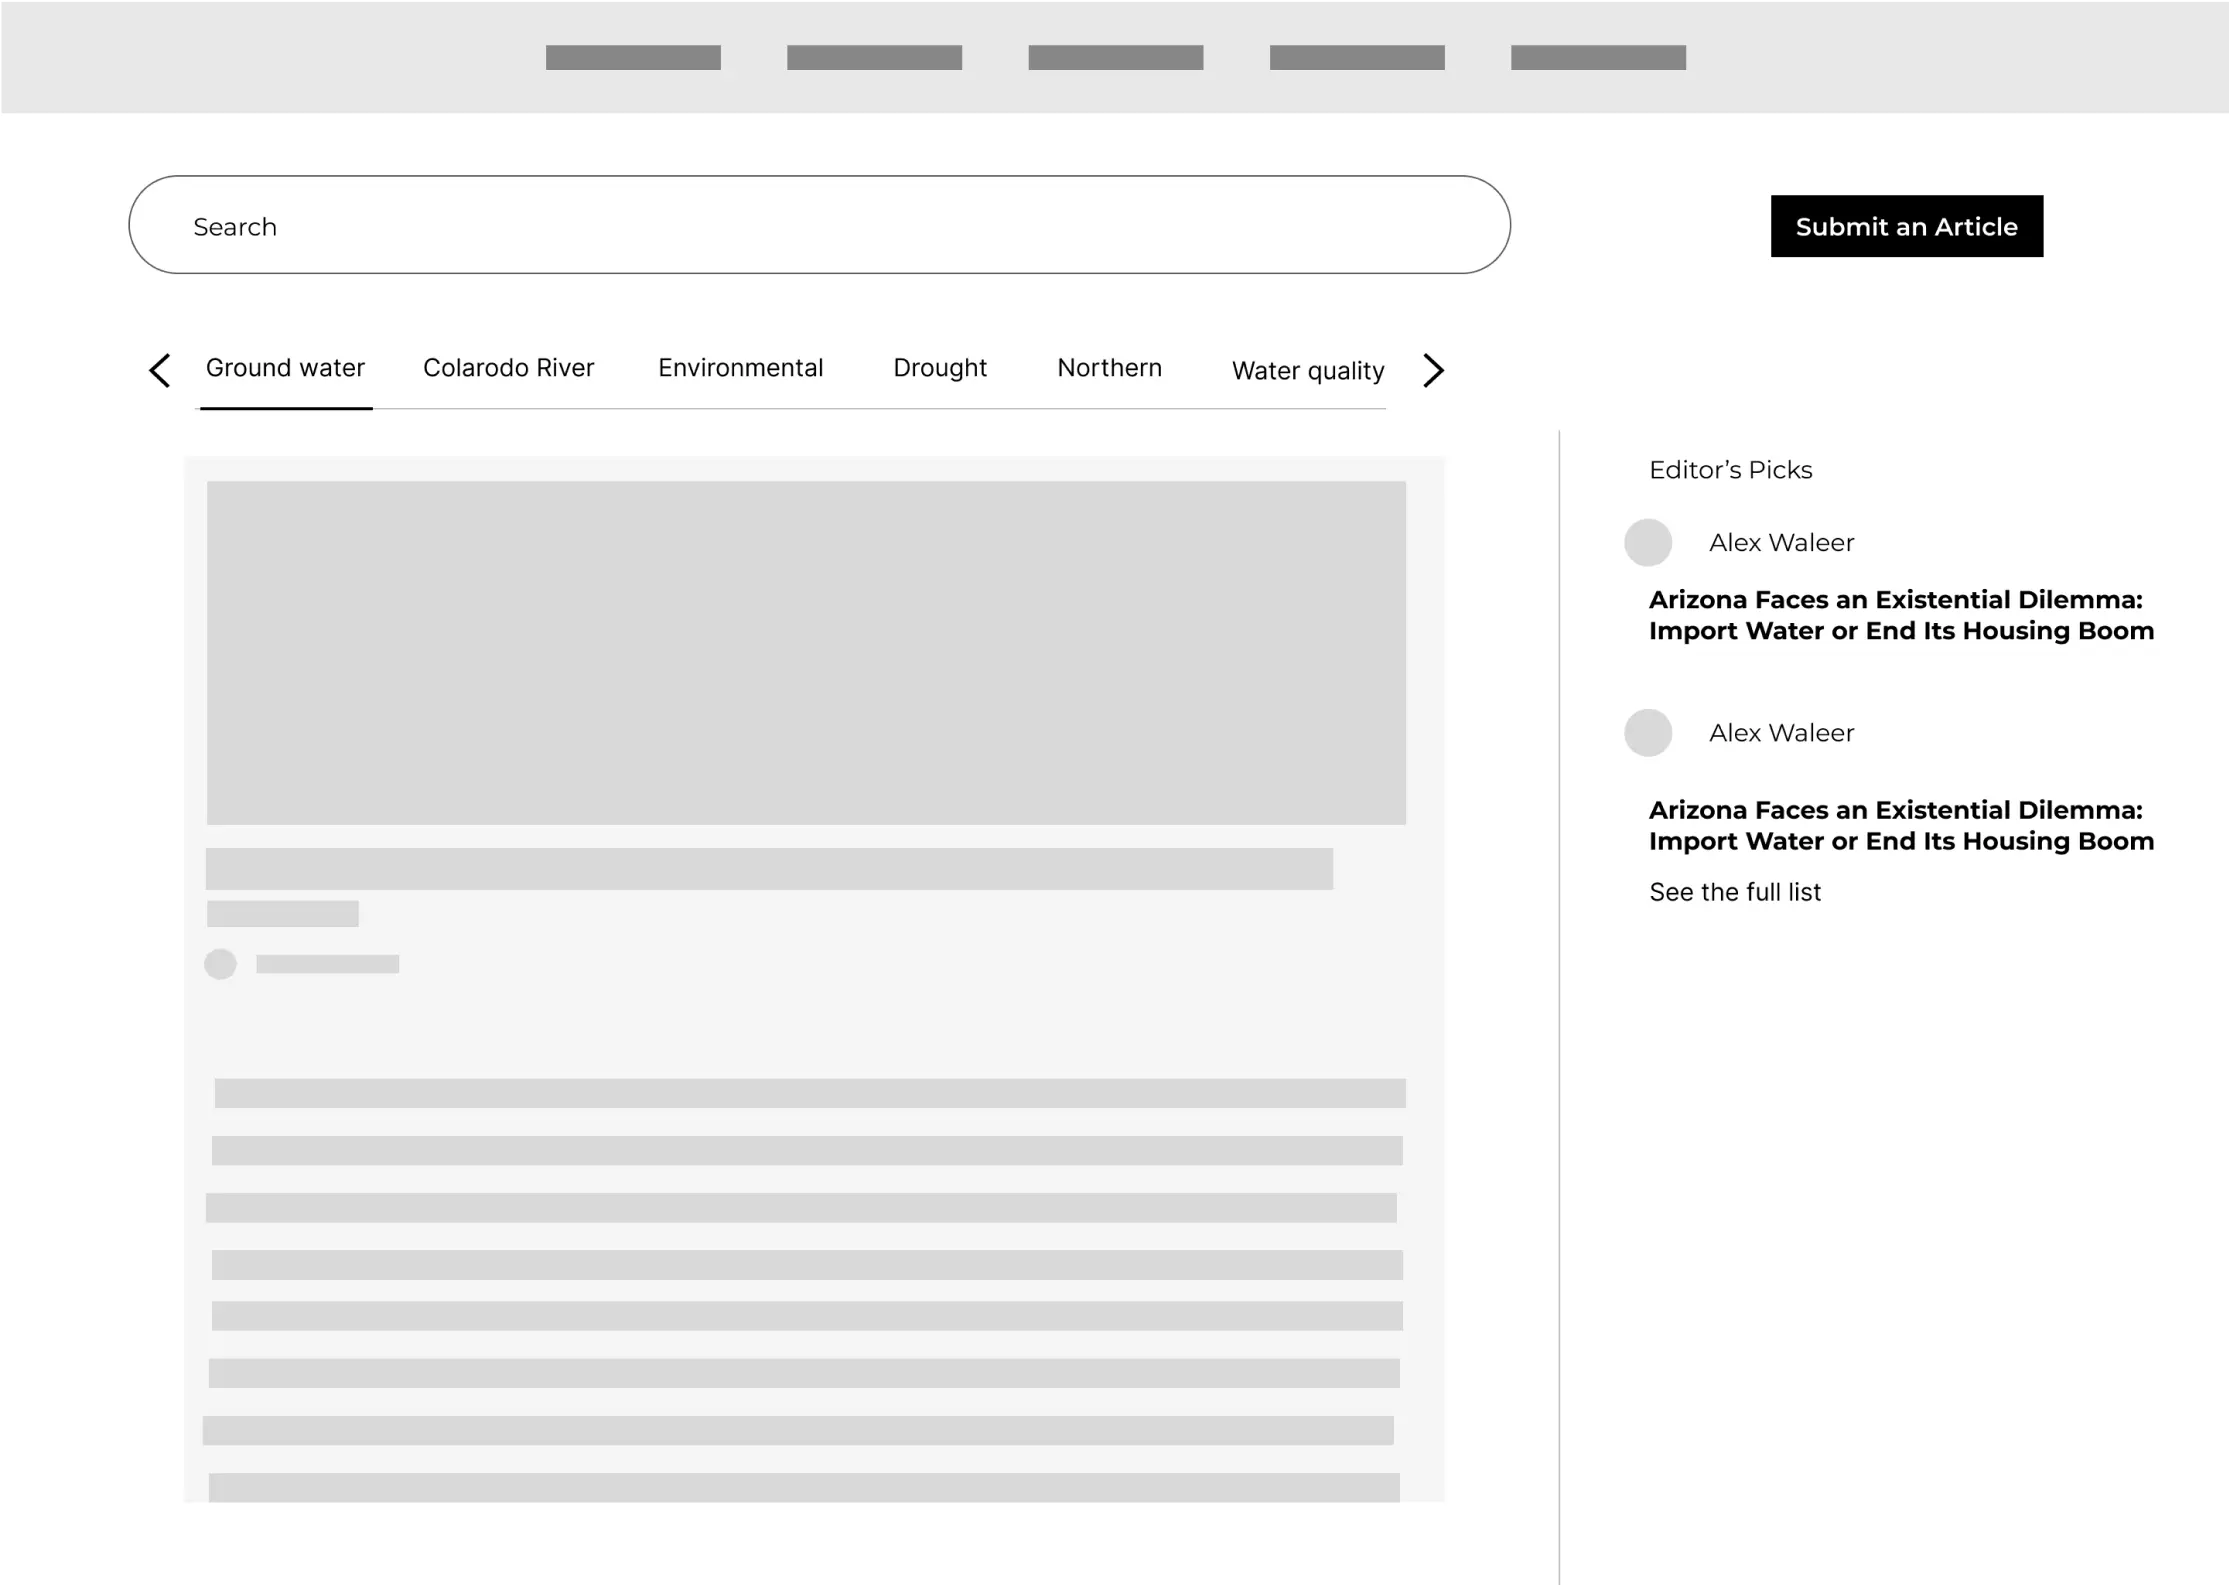
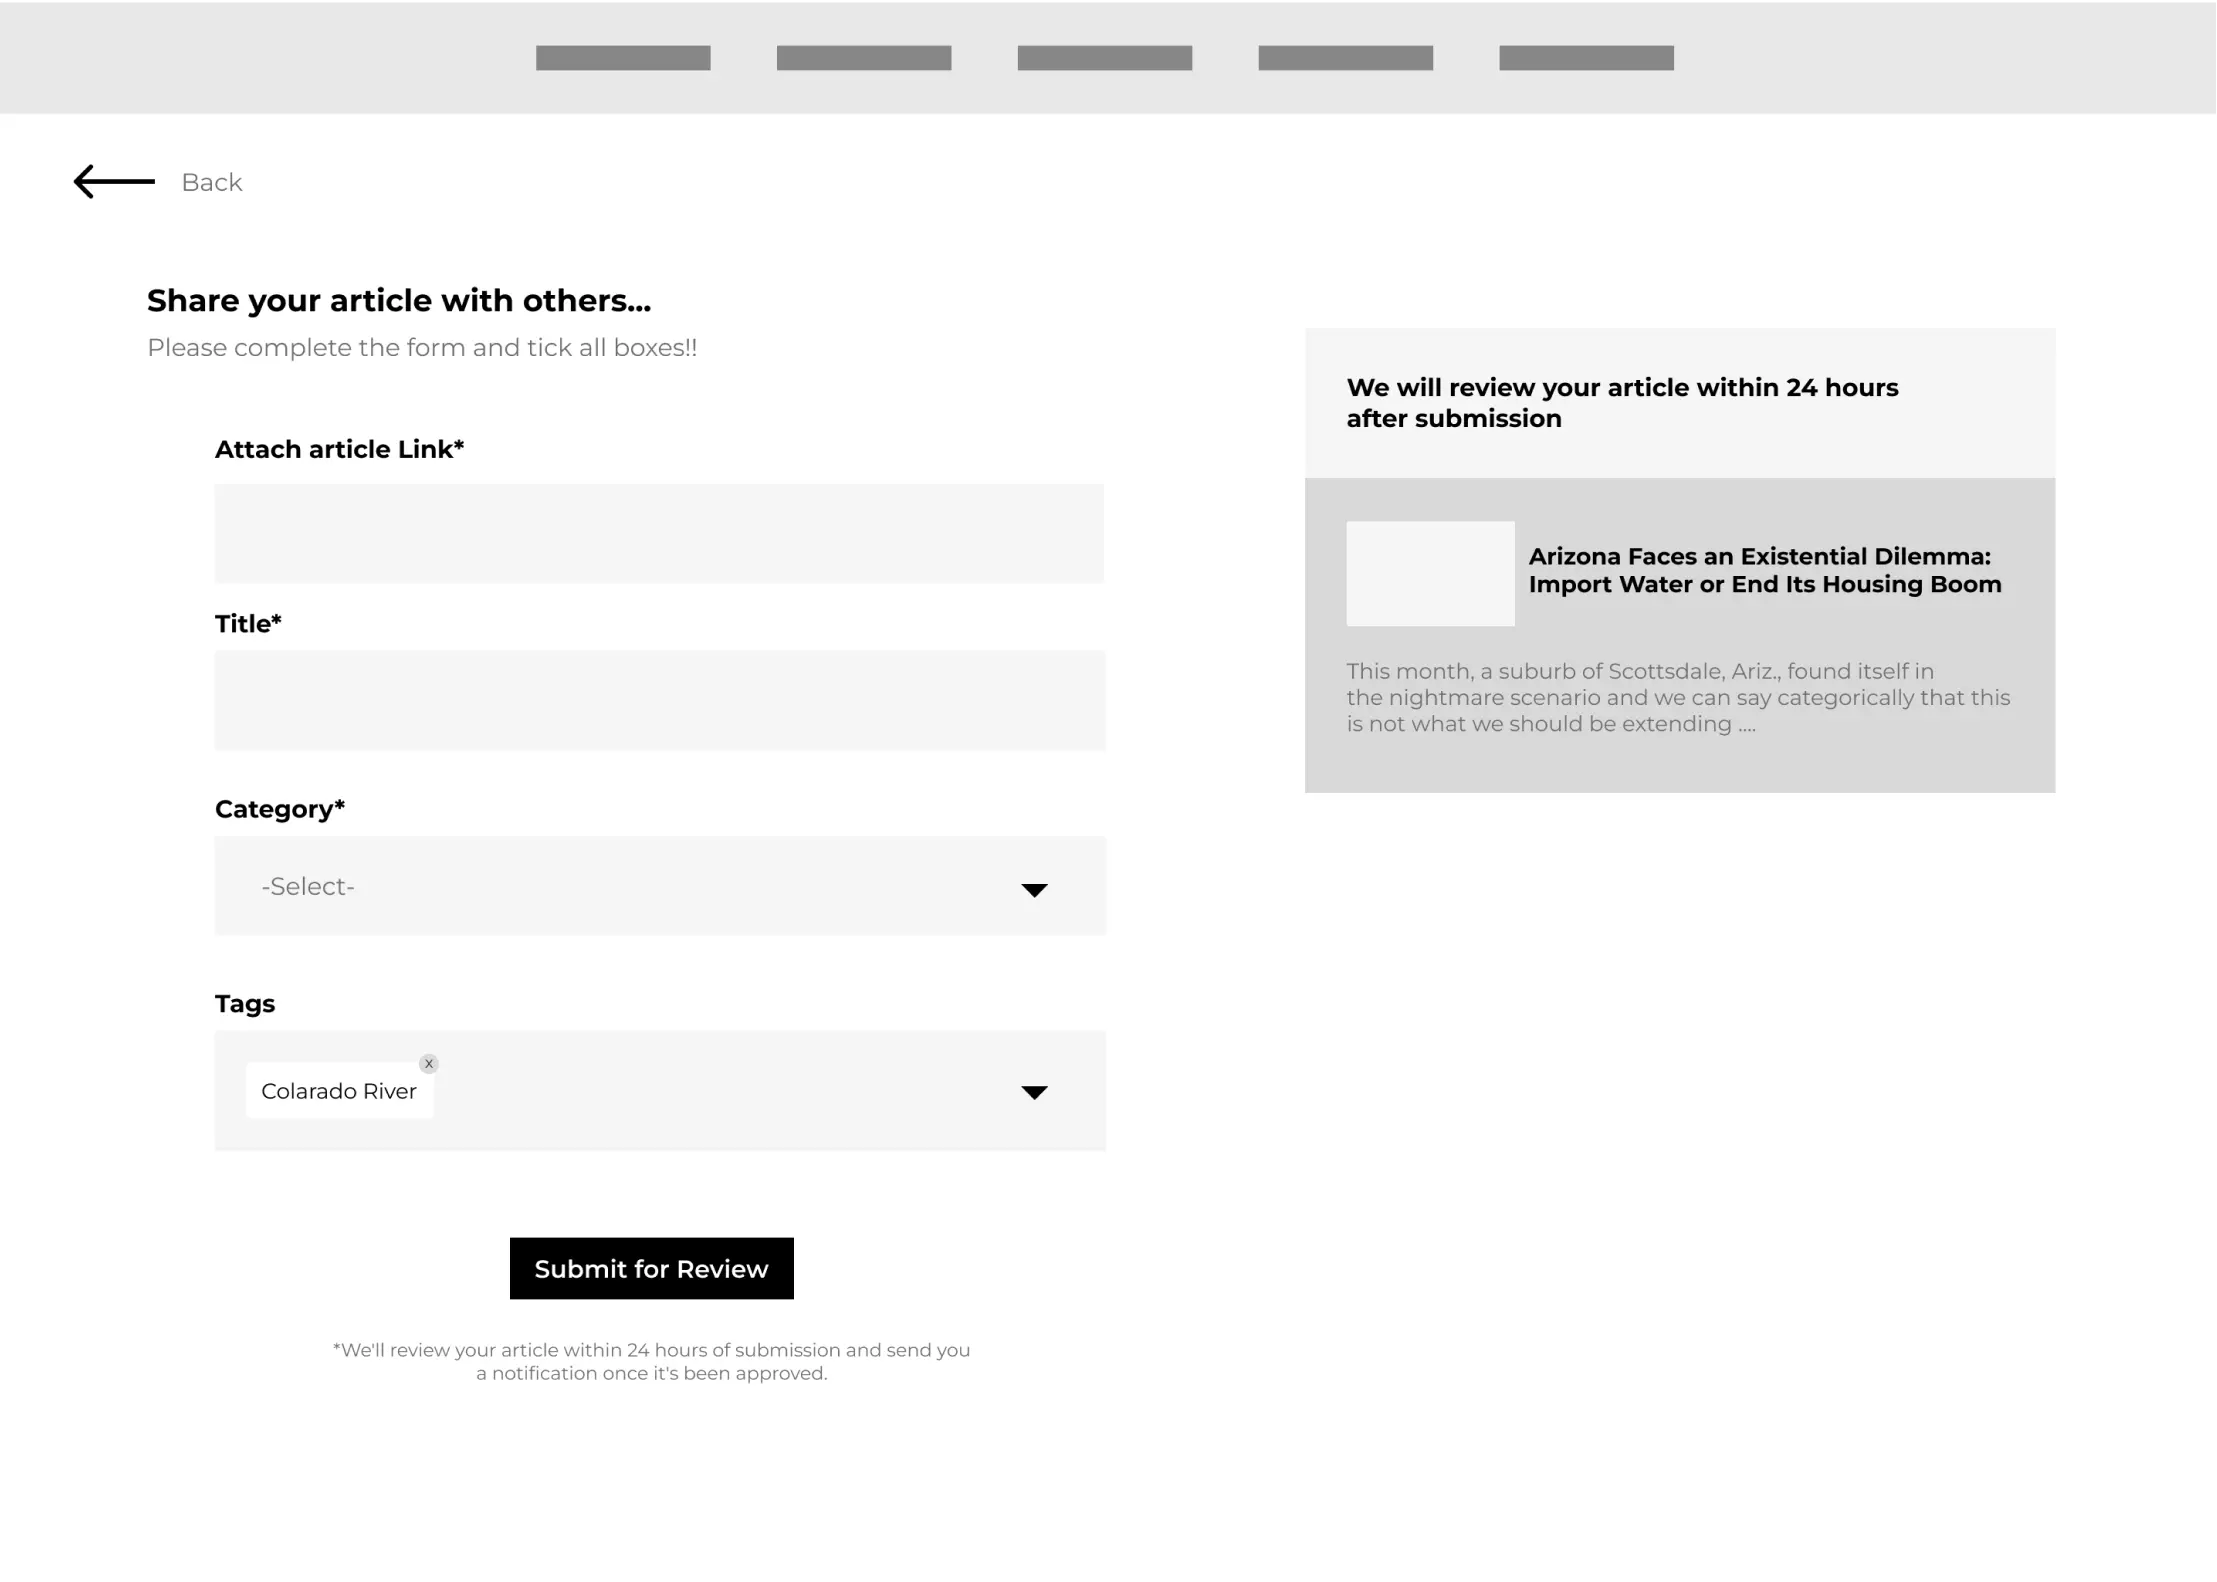
Wireframes
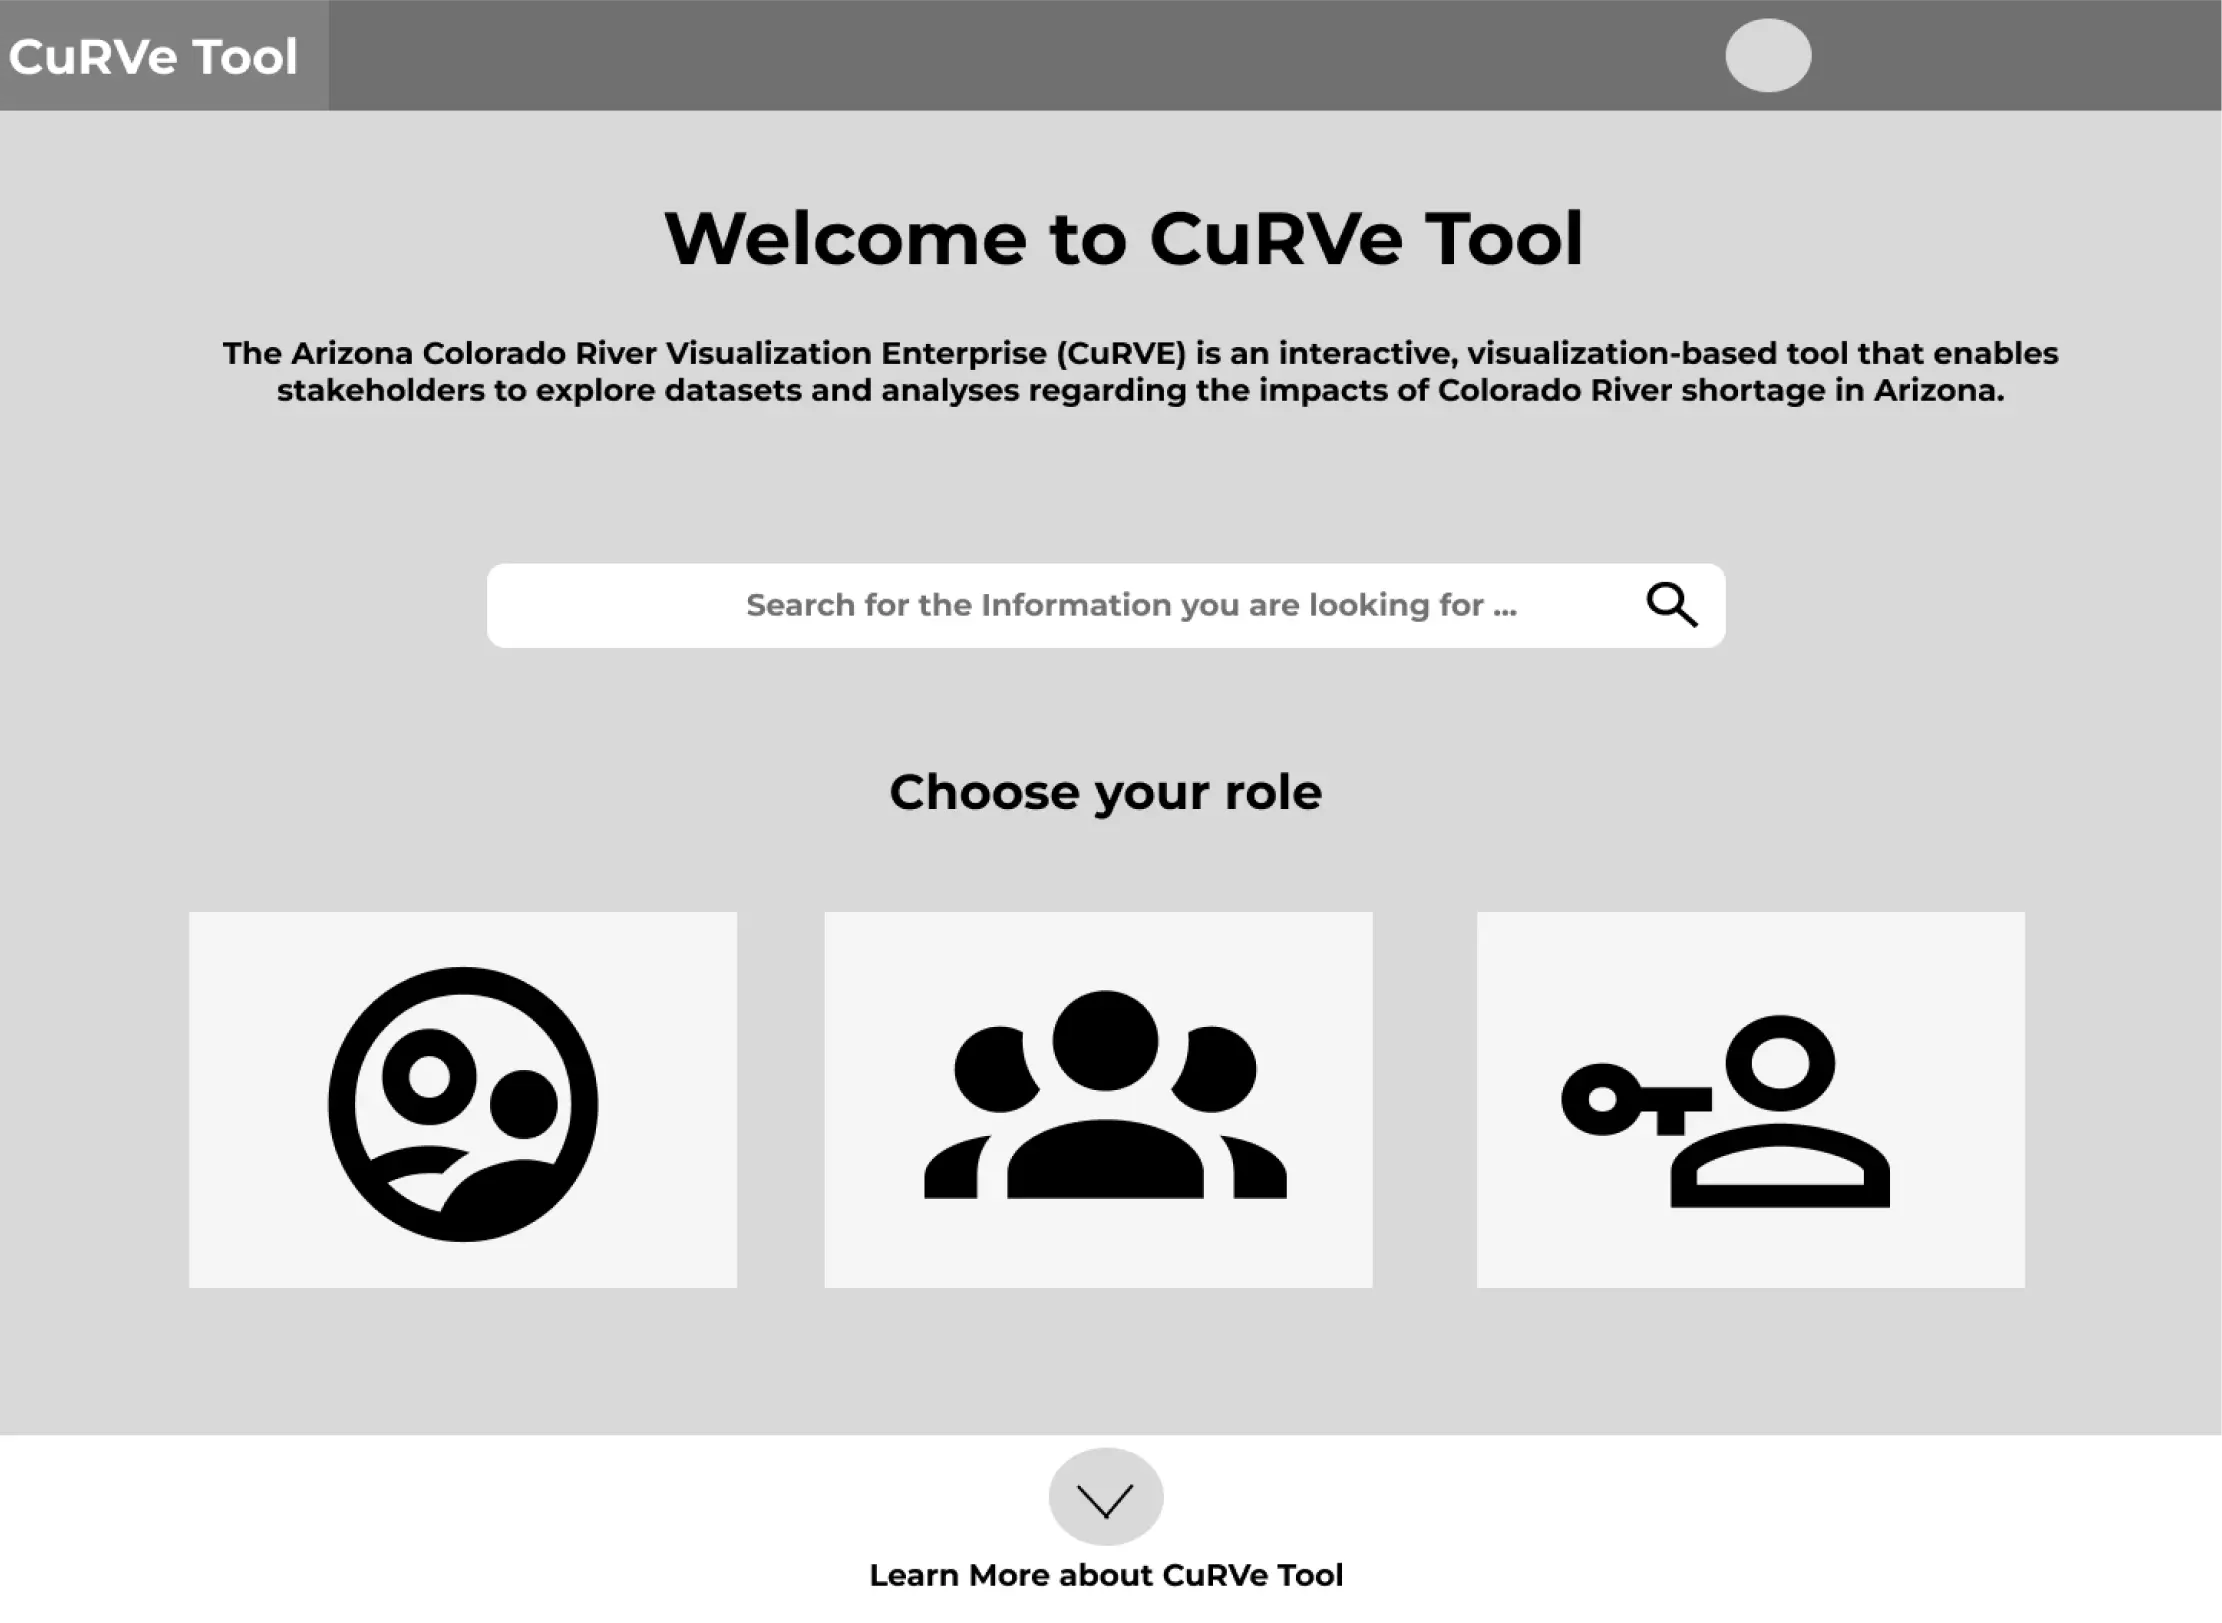
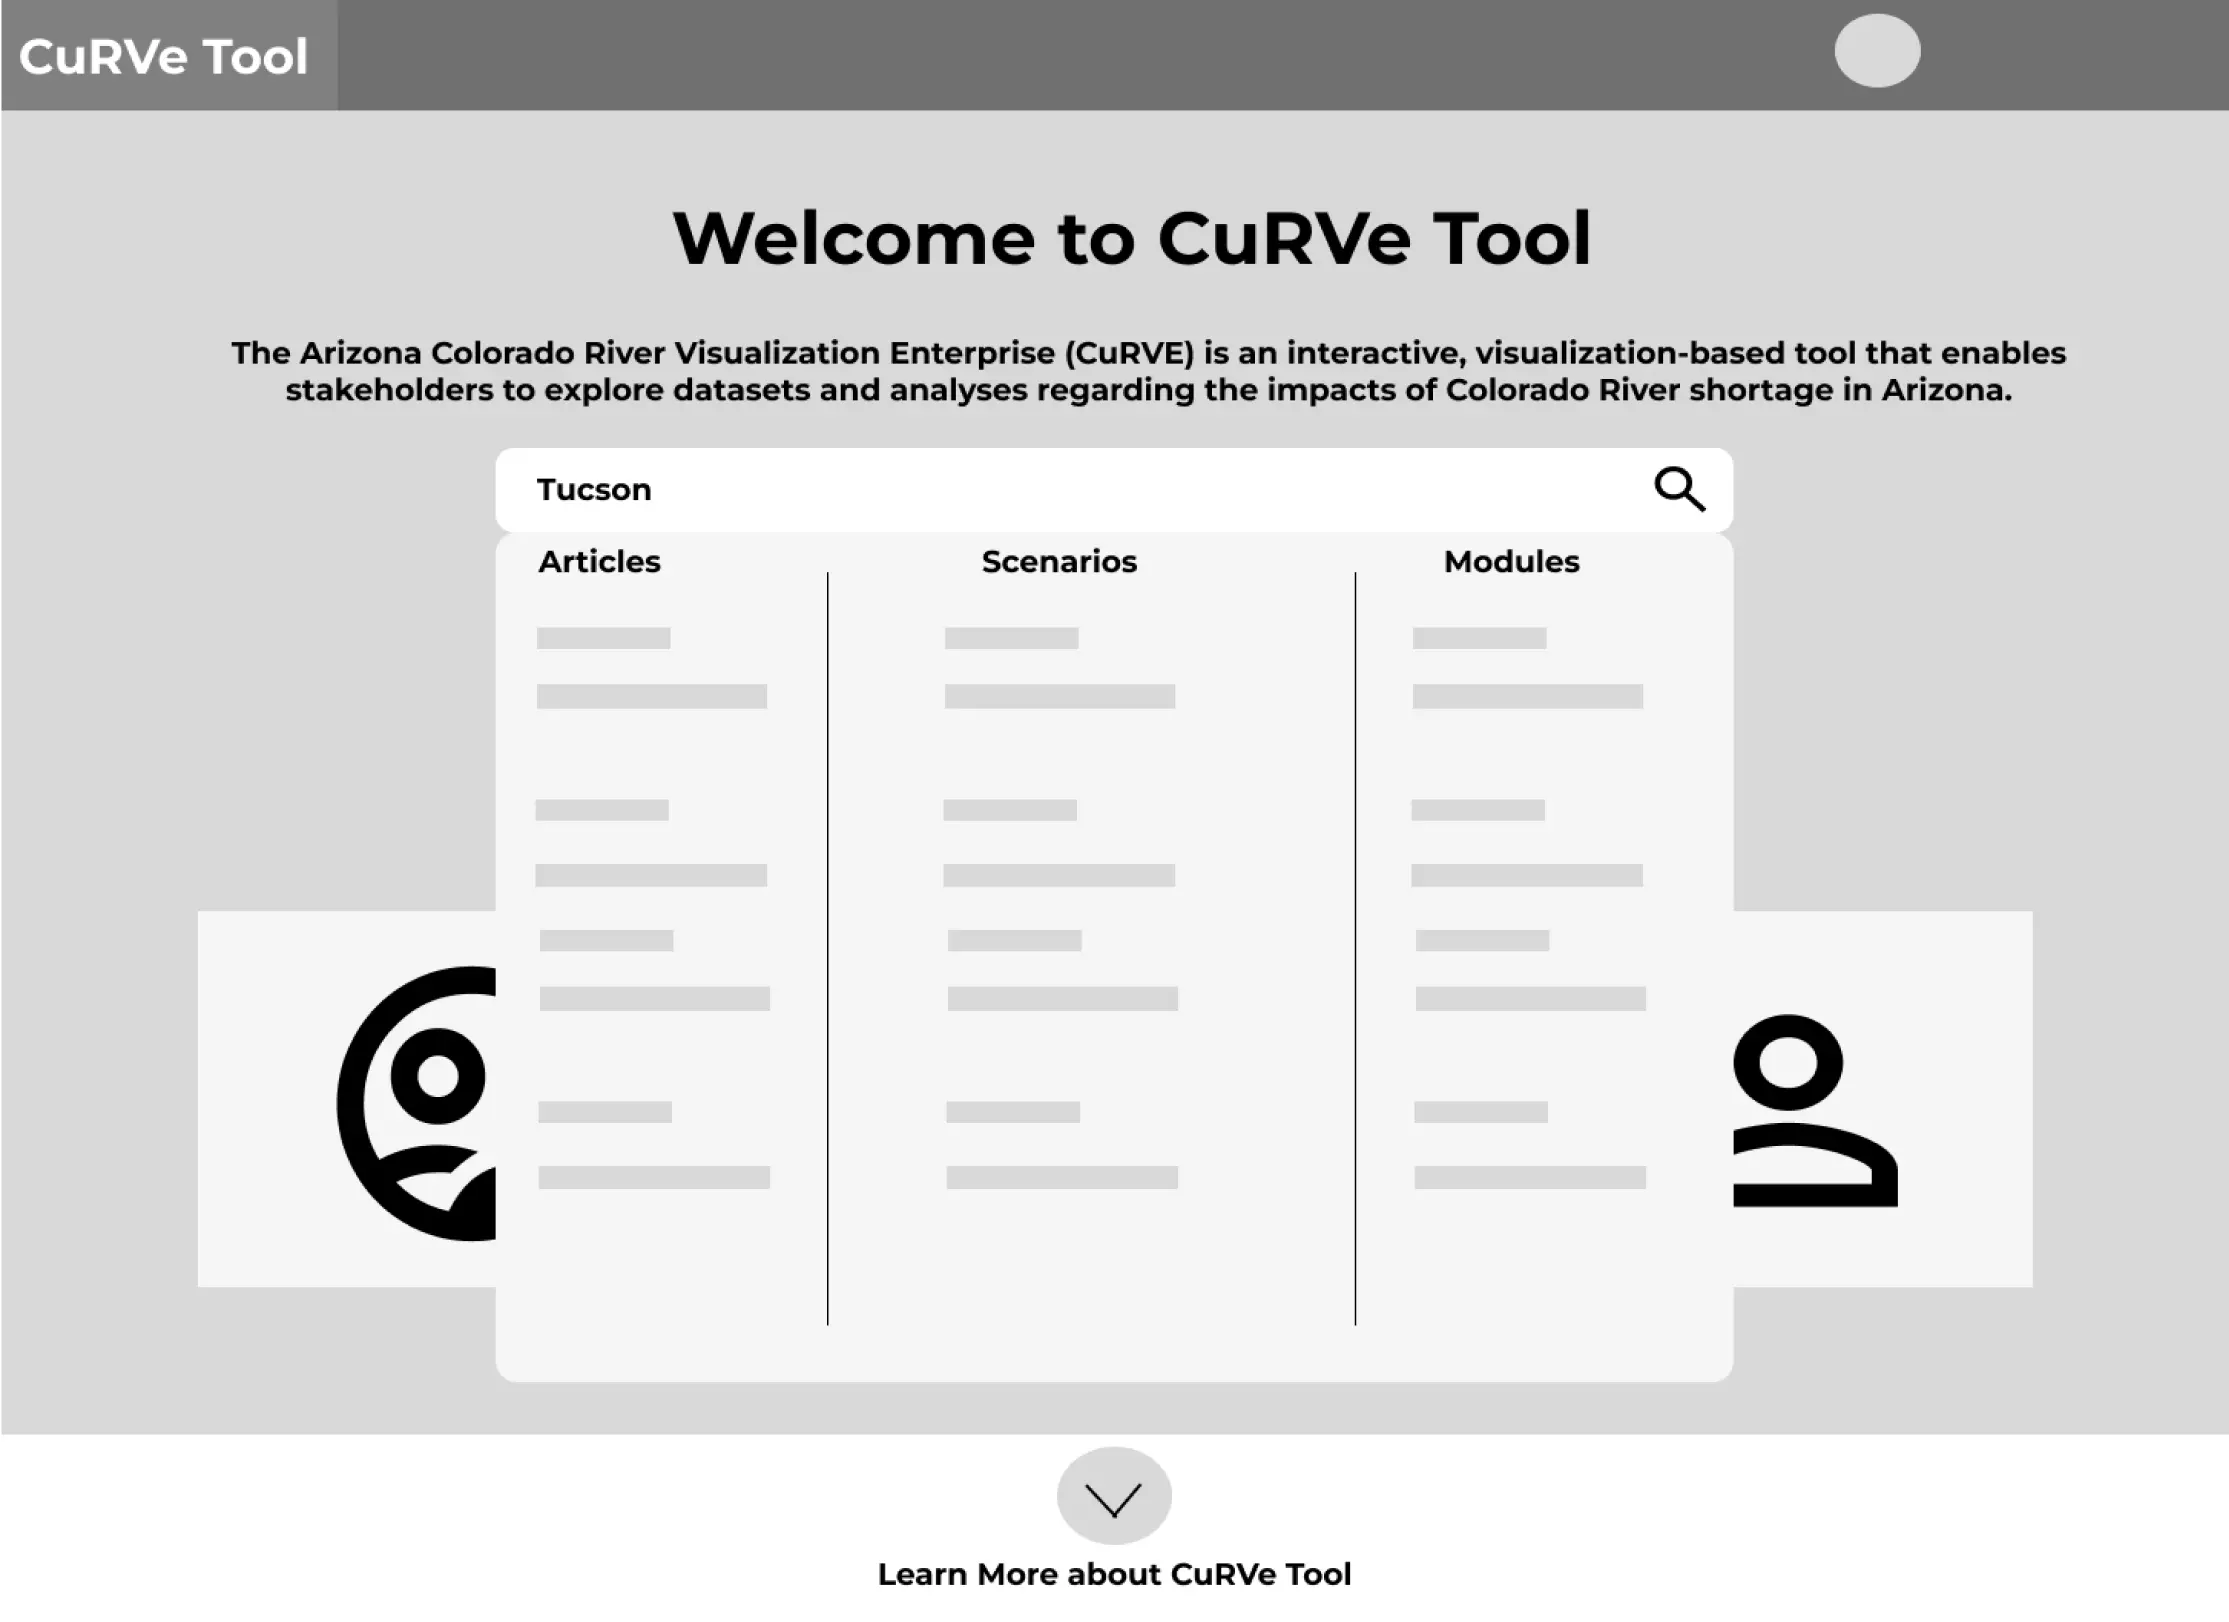
As we progressed through the project, we aimed to create a more holistic experience for our target users. To achieve this, we broke down their goals into tasks and determined how they can seamlessly accomplish them.
After considerable reviews of the wireframes, we came up with an improved set of wireframes to be used for usability testing.
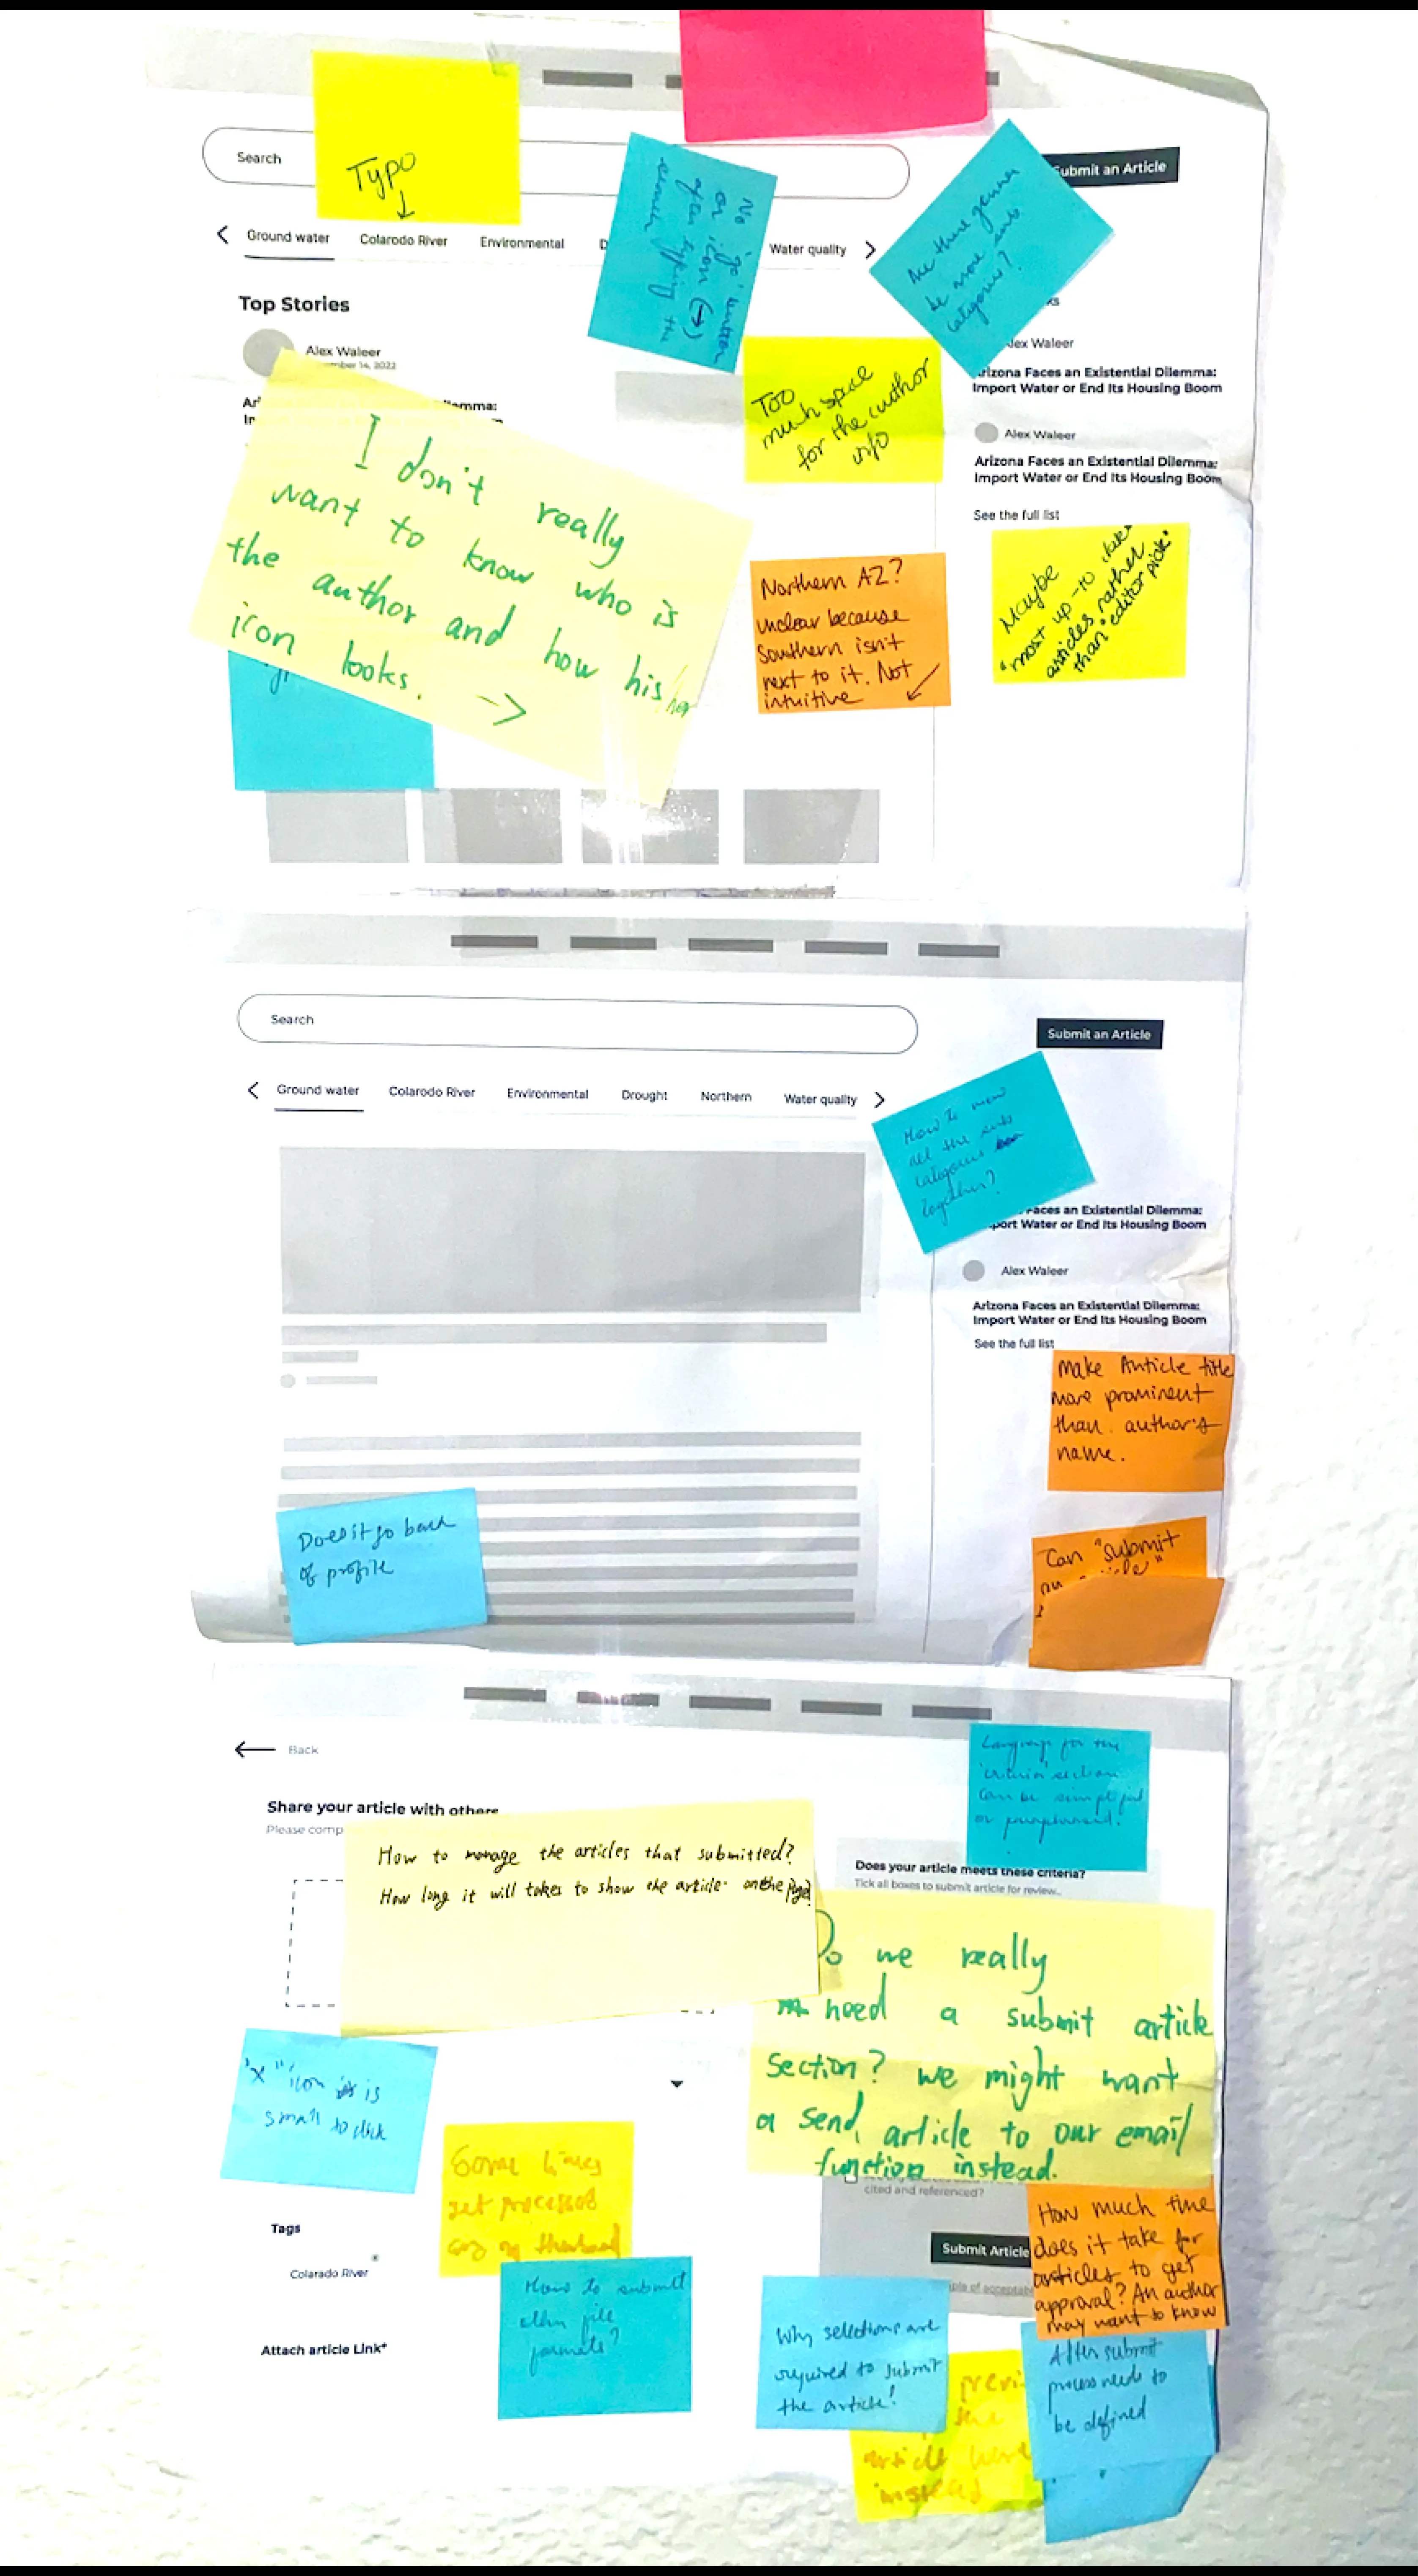
BlackHat Session
Before proceeding to user testing, we conducted a black hat session where we printed our prototype on paper and received insightful feedback. We made necessary changes based on that feedback prior to the user testing.
User Testing
We have created a usability testing plan that outlines our approach to testing, as well as the scenarios and tasks we will use. The plan also includes a post-task questionnaire and a post-test questionnaire. Below is the scenario and tasks we will use:
"You’re a journalist who writes about water issues in Arizona, a colleague just told you about this tool that enables you to post your articles and also read other articles related to water issues."
Task 1 - Explore the available articles and find one that you like
Task 2 -
Attempt to submit the article with title (Arizona Faces an Existential Dilemma:
Import Water or End Its Housing Boom)
Task 3 - Share an article with a friend
